Lightning talks
- Andrea Minano: Tweet-mapping TV ratings of the United States
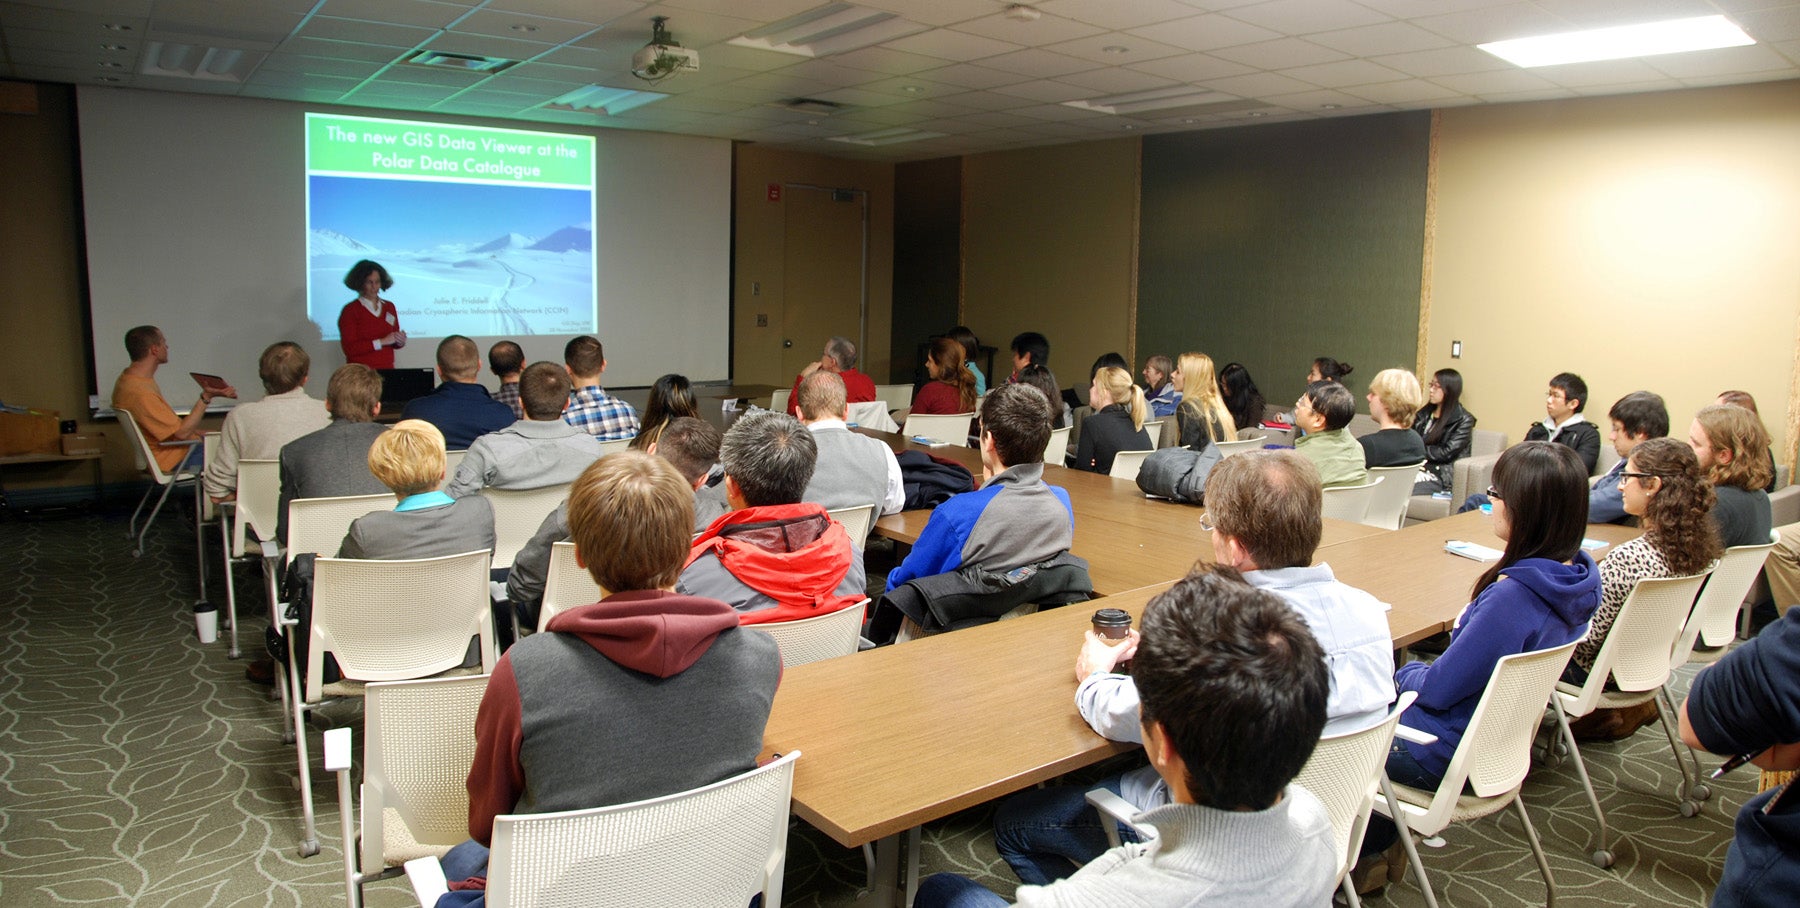
- Julie Friddell: The new GIS data viewer at the Polar Data Catalogue
- Kevin Kang: Monitoring lake ice cover from multi-source spaceborne measurements
- Nastaran Saberi: Snow water equivalent retreival using passive microwave remote sensing
- Cristina Surdu: Arctic lake ice in a changing climate
- Peter Johnson: Citizen editing of government geospatial data using mobile devices
- Andrei Balulescu: The power of automation: Big data
- Bogdan Caradima: Challenges of Python scripting for big datasets
- Yiou Gao: Applied geomatics research laboratory (Part 1)
- Lu Li: Applied geomatics research laboratory (Part 2)
- Jason Neudorf: Accessibility analysis in ArcGIS
- Qing Xiang: Extraction of power lines from airborne laser scanning data
- Henry Luan: GIS-based measurement of school neighbourhood-level flood environment
Digital posters
- Robert Walter-Joseph, Anna Kramer, and Markus Moos: Dimensions of suburbanisms in Waterloo Region
- Sarah Endicott and Michael Drescher: Predicting the spread of European buckthorn in Waterloo Region
- Yoe Dou and Erfu Dai: Ecosystem vulnerability assessment by land use change: A case study at the Pearl River Delta Region, China
- Adam Saunders: Piinpoint: Redefining the site selection experience for franchisors
- Guillermo Azócar, Alexander Brenning, and Xavier Bodin: Spatial modeling of permafrost distribution using rock glacier inventories, topographic attributes and temperature data in the Semiarid Andes, Chile
Live demonstrations
Julie Friddell: Geospatial data in the Polar Data Catalogue
Julie will be demonstrating the Polar Data Catalogue online search tool, focusing on the new GIS Viewer that was released this summer.
Junzhu Li: Spatial patterns of soil organic carbon (SOC) distribution in Canadian forest ecosystems: An eco-region based exploratory analysis
Junzhu's demonstration is about how to apply incremental spatial autocorrelation analysis and why this tool is useful in hotspots analysis.