The chart will eliminate the potential for inconsistent eye results, as it addresses challenges presented by the language’s complexity. Dr. Balsam Alabdulkader, a PhD student at the School of Optometry & Vision Science, was inspired to create the chart after returning to her clinical job in Riyadh, Saudi Arabia, and becoming frustrated with what was available – or, more precisely, what wasn’t.
“For my masters thesis project, I worked on the gold standard chart in English and learned about the importance of the standardized features in near acuity charts. I wanted to get a standardized chart in Arabic for my testing patients,” she said. “I then discovered that we don’t have one.”
There are no standard texts in Arabic from which to draw sentences and there is no standard or accepted font in Arabic, said Dr. Susan Leat, who supervised the project. “Nor is there any standard method of determining the size of Arabic text, as there is in languages, such as English, that use Roman letters.”
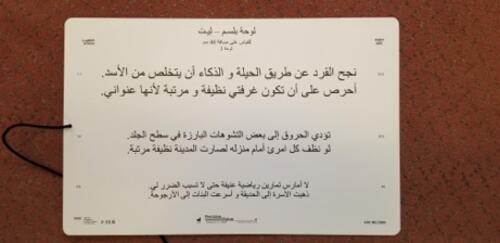
When creating reading acuity charts, sentences are selected and tested for grade level, reading speed and other factors. Outliers are removed so that the sentences are consistent in their level of difficulty. The sentences are then arranged in a standard format, with sentences that gradually become smaller in a logarithmic scale, as the patient reads down the chart.
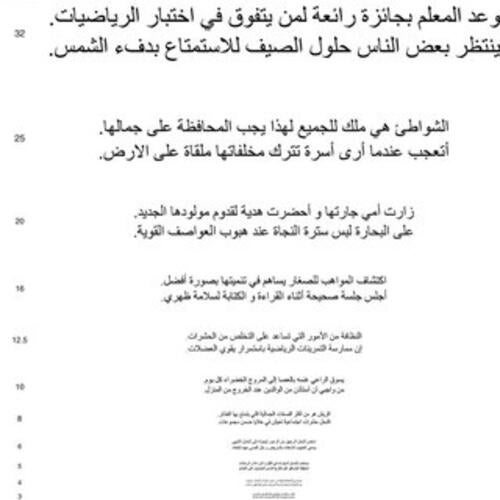
Chart layout with candidate sentences.
To determine font size, chart designers use the x-height (the distance between the baseline and the top of lower-case letters). This system works well for Roman letters. Arabic, however, is cursive, meaning the letters join together, and there is wide variation in letter height.
To overcome this challenge, Dr. Alabdulkader and Dr. Leat used a single repeated sentence, and picked one letter to use as a “yardstick” to determine the font size for each line and the spacing between the lines.
As there is no way to physically compare the Arabic print size to Roman letters, Dr. Alabdulkader and Dr. Leat empirically scaled the Arabic print against English using the reading performance of participants who could read both languages.
The resulting BAL (Balsam Alabdulkader-Leat) chart is available in three different versions. Each chart has fifteen print size levels that are labelled in logMAR and point size.
With help from WatCo, the University of Waterloo’s Commercialization Office, the two researchers have obtained copyright on the BAL chart and have now commercialized it through Precision Vision. It went on sale for the first time at the Academy of American Optometry conference in San Antonio in November 2018.