April 24, 2015
Astrophysicists create 3D master map of the universe
Waterloo astrophysicists have created a spherical map spanning nearly 2 billion light years that is the most comprehensive map of the universe to date
Waterloo astrophysicists have created a spherical map spanning nearly 2 billion light years that is the most comprehensive map of the universe to date
University of Waterloo astrophysicists have created a 3D master map of the universe spanning nearly two billion light years that is the most complete picture of our cosmic neighbourhood to date.
The innovative spherical map of galaxy superclusters will help astrophysicists understand how matter is distributed in the universe and provide key insights into dark matter – one of physics’ greatest mysteries.
Professor Michael Hudson, Jonathan Carrick and Stephen Turnbull, of Waterloo’s Department of Physics and Astronomy, and Guilhem Lavaux of the Institute d’Astrophysique de Paris of the Centre national de la recherche scientifique of France, created the map. Hudson is also an affiliate member of the Perimeter Institute of Theoretical Physics in Waterloo.
“The galaxy distribution isn’t uniform and has no pattern. It has peaks and valleys much like a mountain range. This is what we expect if the large-scale structure originates from quantum fluctuations in the early universe,” said Hudson, associate dean of science, computing.
The map of the universe is published online in the peer-review journal, Monthly Notices of the Royal Astronomical Society — one of the world’s leading primary research journals for astronomy and astrophysics.
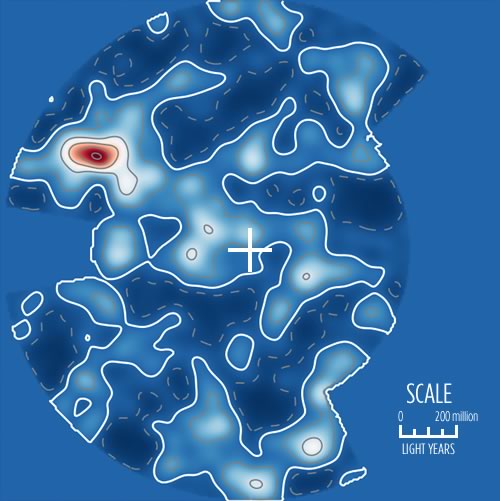
A slice through the 3D Map of the nearby Universe. Our Milky Way galaxy is in the centre, marked by a cross. The map spans nearly two billion light years from side to side. Regions with many galaxies are shown in white or red, whereas regions with fewer galaxies are dark blue.
The lighter blue and white areas on the map represent greater concentrations of galaxies. The red area is the supercluster called the Shapley Concentration, the largest collection of galaxies in the nearby universe. Unexplored areas are marked in uniform medium blue.
Knowing the location and motion of matter in the universe will help astrophysicists predict the universe’s expansion and identify where, and how much dark matter exists.
Scientists have observed that galaxies move more than can be accounted for by the universe’s expansion. These discrepancies are called peculiar velocities. For example, our own Milky Way galaxy and its neighbour Andromeda are moving with a speed of 2 million km/hr.
Previous models haven’t fully accounted for this observed motion. Hudson and his team are interested in discovering what structures are responsible for the peculiar velocities. These deviations in the motion of galaxies are a valuable tool to determine the distribution of matter and dark matter on the largest scales.
Dark matter accounts for a large majority of the mass content in the universe. It is a hypothesized form of matter particle that does not reflect or emit light and as a result it can’t be seen or measured directly. The existence and properties of dark matter can only be inferred indirectly through its gravitational effects on visible matter and light.
“A better understanding of dark matter is central to understanding the formation of galaxies and the structures they live in such as galaxy clusters, superclusters and voids,” said Hudson. The next step is to get better maps and better samples of peculiar velocities to compare with our maps. The team is working on the latter with collaborators in Australia.
The video shows a 3D Map of the nearby Universe, where we take successive slices. The volume mapped is roughly circular, so it's a bit like slicing an orange vertically from the edge through to the opposite edge. The location of our Milky Way Galaxy is in the centre of the middle frame (marked SGZ=0) halfway through the movie.
The map spans nearly two billion light year from side to side. Regions with many galaxies are shown in white or red, whereas regions with fewer galaxies are dark blue. It shows the density field smoothed with a Gaussian window of 4 Mpc/h.