Contact


Roy Brouwer, Department of Economics, University of Waterloo

Jorge Garcia, Department of Economics, University of Waterloo

Rute Pinto, Department of Earth and Environmental Sciences, University of Waterloo
Introduction
The Great Lakes Basin (GLB) is a region of significant importance for Canada and the United States (US) in terms of water resources, biodiversity, economy, and population. In terms of economic value of the GLB, 38 per cent of Canada’s GDP and 27 per cent of that of the US are generated in and around the Great Lakes, amounting to a joint GDP of 5.9 trillion in 2018 US dollars.
Over the past decades, population and economic growth have compromised the GLB’s long term sustainability, mainly due to the emission of a wide range of pollutants over land, like nutrient runoff from agriculture, and directly into the water such as the discharge of residential and industrial wastewater. Total phosphorus (TP) loads entering the lakes have increased eutrophication and resulted in more frequent outbreaks of harmful algal blooms (HAB’s), especially in Lake Erie and Lake Ontario.
In response to these increasing pressures, among others, the Canada-Ontario Lake Erie Action Plan (LEAP) was adopted. This Plan outlines a 40 per cent reduction target of TP-loads on the Canadian side of Lake Erie compared to 2008 levels, in particular for the central basin of Lake Erie.
Given the large economic interests involved and the fact that emission reductions of this size may have broader economic impacts on the economy as a whole, both on the Canadian and US side of the Great Lakes, an integrated hydro-economic model was developed for the GLB. This model aims to shed light on the total direct and indirect economic impacts on the Canadian economy of different TP reduction scenario’s across lakes and sectors.
Methodology
The integrated hydro-economic model allocates TP emissions to the (i) specific economic sectors in the GLB economy that produce these emissions, and (ii) relevant lake drainage regions where these activities take place. Phosphorus emission data from point and non-point sources were collected or estimated using different available data sources, including the National Pollutant Release Inventory (NPRI), the Wastewater Systems Effluent Regulations (WSER) database, and census data at the lowest spatial scale.
In view of the fact that important trade flows exist between the GLB in Ontario and other provinces in Canada and part of economic production in the GLB is also exported outside Canada, the economic model for the GLB has connections to the rest of the province of Ontario and the rest of Canada.
Once the ‘goods’ produced by the different sectors in the GLB were coupled to the associated TP emission flows (‘bads’), four TP reduction scenarios were created, each targeting specific lakes or sectors in the GLB (Table 1). Under each scenario, an economic optimization model then helped to achieve the imposed TP-reduction targets at the lowest total economic cost possible in terms of loss of GDP compared to the current situation (across a continuum from 1 to 50 per cent TP emission reduction).
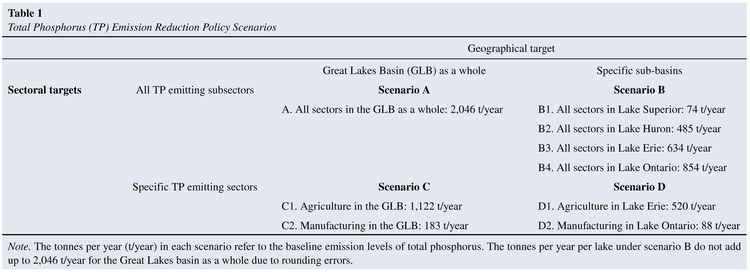
Scenario A involves the reduction of TP loads to water bodies coming from all P-emitting sectors (agriculture, manufacturing and wastewater treatment plants) located inside the Canadian GLB. Scenario B consists of four lake-specific emission reduction policy interventions, one for each lake in the GLB. This scenario is stricter than Scenario A because now each lake has to meet the same percentage TP emission reduction target instead of reducing TP-levels for the GLB as a whole. Scenario C evaluates the effect of sector-specific TP emission reductions in the GLB for the P-emitting sectors of agriculture and manufacturing. Finally, scenario D evaluates the economic costs of TP emission reductions targeting non-point sources (agriculture) in Lake Erie and point source pollution (manufacturing) in Lake Ontario. Due to space limitations, we only show the results here for scenarios A and D1.
Outcomes
Under most scenarios, the pollution reduction costs show a nonlinear increase as the reductions of TP emissions become more stringent. For example, the economic costs in scenario A, depicted in Figure 1, are initially relatively low, up to a 10-15 per cent emission reduction level, but increase sharply at higher levels.
The cost structure changes too depending on the imposed policy target. For scenario A, direct costs initially account for more than 60 per cent of the total costs and gradually decrease to 20 per cent when approaching the highest TP-reduction target of 50 per cent. This indicates that indirect costs related to impacts throughout the economy as a whole play an increasingly important role for larger TP-reduction targets.

Figure 1. Canadian value-added loss (in annual Canadian dollars and %) by type of economic cost under scenario A, aiming to reduce total Phosphorus (TP) emissions (in tonnes per year and %) from all industries located in the Great Lakes Basin.
The total costs of reducing agriculture emissions into Lake Erie (scenario D, depicted in Figure 2) are an order of magnitude lower than those for scenario A. Reducing the emission of TP into Lake Erie from agricultural activities by 40 per cent results in a total economic cost of CAD $0.85 billion or a loss of 0.11 per cent of Ontario’s GDP in 2016.
To illustrate the effect of including pollution abatement measures, we re-ran scenario A where agriculture, as the largest emitter of TP in the GLB, is allowed to adopt pollution abatement measures, called Best Management Practices (BMPs), as another mechanism to reduce TP runoff into the Great Lakes. This resulted in substantially lower economic costs.
Another insight from the model exercise is that the costs of pollution abatement are overall an order of magnitude larger in manufacturing than in agriculture.
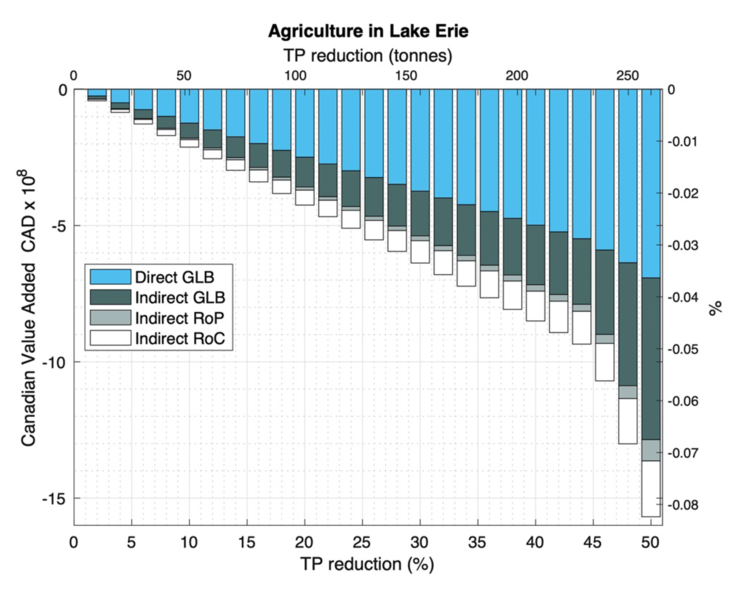
Figure 2. Canadian value-added loss (in annual Canadian dollars CAD and %) by type of economic cost under scenario D1, aiming to reduce total Phosphorus (TP) emissions (in tonnes per year and %) from agriculture around Lake Erie.
Conclusions
Located in the economic heart of the Canadian economy, the GLB provides a variety of ecosystem goods and services, especially as a sink for the negative by-products of economic activities, in particular the emission of TP and eutrophication. The economic damage costs of eutrophication are considerable and have been estimated for the Canadian side of Lake Erie under a business as usual scenario, for example, at CAD $270 million per year. The newly developed hydro-economic model for the GLB helps us to identify the least-cost way to reduce TP emission levels across economic sectors and lakes. Comparing the estimated damage costs with the predicted economic pollution reduction costs using this new model then allows us to assess economically efficient pollution levels where the costs of pollution control equal the avoided damage costs.
The results from the scenario analysis show that the more flexibility there is in reducing existing emission levels across lakes and sectors, the lower on average the pollution reduction costs. Pursuing a policy of emission reductions across the entire GLB, irrespective of the TP-emitting sector or the particular drainage region where TP releases take place, as under scenario A, results in the lowest average costs in terms of dollars per tonne of TP reduced. Paramount in reducing the growing frequency of HAB’s in the GLB is of course the inclusion of the US side in a more comprehensive international assessment of the costs and benefits of TP emission reduction strategies to combat the negative impacts of eutrophication and HABs on the people, communities and economic activities around the GLB.
Garcia-Hernandez, J. A., Brouwer, R. and Pinto, R. (2022). Estimating the total economic costs of nutrient emission reduction policies to halt eutrophication in the Great Lakes. Water Resources Research, 58, e2021WR030772. https://doi.org/10.1029/2021WR030772
Photo: Algae by Monteregina (Nicole) original image is licensed under CC BY-NC-SA 2.
For more information about WaterResearch, contact Julie Grant.