Introduction
Your students may find it interesting to determine and compare the acid content of individual sour hard candies. In addition to doing the titration analysis and the calculations, reported as the percent by mass of citric acid, students can learn about the technology of candy making. For students doing precision titrations there can be an exploration of the simple statistics of the analytical results.
Individual sour hard candies each contain an amount of total acid that is conveniently determined by a student titration with 0.1 M NaOH solution. The previous article in this series contains useful data and references for the calculations (Acid-base titrations: comparing the acid content of low-acid fruit juices to regular fruit juices, Chem 13 News, October 2013, pages 4-5).
Titrations of individual candies were initially being carried out in order to find a simple, no-volume-measurement sample type for drop-count titrations.1a Interestingly, the percent by mass of total acid in individual Vicks® brand2 sour hard sugar candies of the same batch was found to be considerably more variable than that in individual Sorbees® brand3 sour hard sugar-free candies. This may be due to the method of production of sour hard sugar candy, as explained below.
Titrating sour hard candies and cough drops
Hard candies are made using sugar (sucrose) or sugar substitutes (sugar-free) as the matrix material. The Sorbees candy contains a substance called maltitol as a replacement for sucrose. A sour taste is imparted by adding citric acid or a citric acid–tartaric acid blend. No volume measurement is needed for the samples but instead a mass measurement using a 2-place digital top-loading balance. This simplifies and speeds up the experiment considerably relative to analysing a solution unknown.
The citric acid or citric acid–tartaric acid blend may be inside the candy, or on the surface as a powder, or both. For titration, use only candies that have a smooth, powder-free surface. Acid powder on the surface can be expected to give a much more variable acid content result.
Experimental method and results
Each individual candy was dissolved into 25 to 30 mL of distilled water in a 125-mL Erlenmeyer flask after the mass was determined on a 2-place balance.
Handling with clean, dry fingers does not significantly affect the mass. Dissolving takes about 45 minutes without swirling, but considerably less time with swirling and/or warming. Titration was performed using phenolphthalein indicator and 0.1 M NaOH solution, generally to a pale yellow to orange-red end-point colour change. Titrations may be performed using buret technology or by the gravimetric method (Gravimetric titration: simple, buret-free, and high precision, Chem 13 News, December 2012 / January 2013, pages 12-14).
The sample results in Table 1 and Table 2 were obtained by the gravimetric method.1b This method is especially suitable for candies containing smaller amounts of acid, such as the Vicks candies; the titration range for these samples being 2.7 - 3.3 g. Sour hard candies and cough drops come in a range of sizes and acid content. A Life Savers® brand4 sour-lemon sugar candy has about three times as much acid as a Vicks candy and a sugar-free sour-lemon Sorbees candy has almost six times as much acid content as a Vicks candy.
The percent by mass of the citric acid in each sample titrated was calculated individually. Table 1 contains full data for one titration each of a Vicks and a Sorbees candy. Table 2 contains the final calculation results of six samples of each kind, and the data for two comparison sets, as described below.
Table 1: Example data for titrations with 0.1 M NaOH solution
| Sample | Drop mass (g) | 0.1 M NaOH mass (g) | Citric acid mass (mg) | %Citric acid (by mass) |
| Vicks | 2.17 | 3.14 | 20.1 | 0.926 |
| Sorbees | 3.34 | 17.06 | 109.2 | 3.27 |
Surprise! The Vicks sour-lemon hard-sugar cough drops have an acid content that is much more variable than was expected by comparison to a similar titration of apple juice samples (see below). Initial results were confirmed by three further sets of trials on Vicks lemon cough drops. The largest of the trials is summarized in Table 2. This was an unexpected and discrepant event, it having been implicitly assumed that each batch of a particular type of candy would have a uniform citric acid composition. The amount of variability is not great enough to be observed in a simple drop-count titration experiment, but it is easily detected by the high-precision gravimetric titration experiment. A similar titration of a set of sugar-free sour-lemon Sorbees candies produced a second, opposite surprise (see Table 2), because in this case the scatter of results was very small.
Is the acid in the Vicks or Sorbees candies uniform?
At issue is whether the acid content of each batch of candies is uniform (i.e., are they homogeneous). To help decide, a comparison will be made for each candy to a similar analysis of a sample known to be homogeneous.
Table 2: Comparison of titration analysis set results
| Set | Sample Type | Data set (unit) | %RSD |
| 1 | Vicks Lemon Cough Drops | 0.926, 0.907, 0.821, 0.823, 1.022, 0.881 (% m/m citric acid) | 8.4 |
| 2 | Tim Hortons® apple juice | 2.77, 2.60, 2.66, 2.64, 2.67, 2.69 (g 0.1 M NaOH titrant) | 2.1 |
| 3 | Sorbees candies | 3.269, 3.319. 3.280, 3.319, 3.309, 3.323 (% m/m citric acid) | 0.70 |
| 4 | KHP vs NaOH | 0.09509, 0.09455, 0.09418, 0.09437, 0.09514, 0.09476 (mol/L NaOH) | 0.41 |
The Vicks lemon cough drops will be compared to 5 mL samples of Tim Hortons apple juice (Table 2: Set 1 and Set 2). The apple juice samples were titrated by Michael Jansen’s students. Each of these titrations is roughly 3 g (3 mL) of the NaOH solution, so the scattering of results due to the titration method should be similar. The Sorbees candies will be compared to a set of titrations carried out to standardize 0.1 M NaOH solution using primary standard solid KHP (potassium hydrogen phthalate) weighed by 4-place analytical balance (Table 2: Set 3 and Set 4). The two sets of titrations were in the range of 12 – 18 g of titrant, so the scattering of results due to the titration method should be similar.
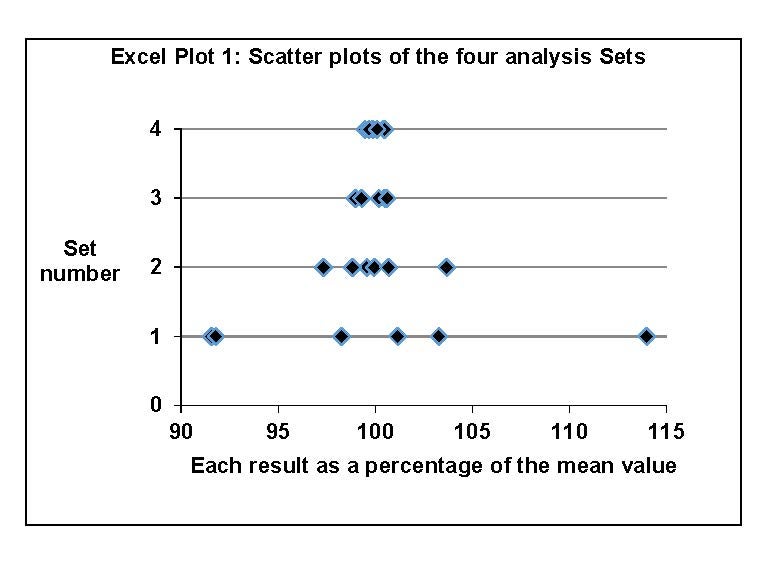
Comparisons using the eyeball method: Excel® was used to plot the four sets of results. Each individual result was converted to a percentage of the mean value of its set and plotted versus its set number (see Excel® Plot 1).
 See notes at end of this article for a refresher on normal distribution and how to compare %RSD results.
Comparing Set 1 and Set 2 in Table 2, the %RSD of the Vicks cough drop results is much greater than the %RSD of the homogeneous apple juice samples for a similar titration amount. Since the apple juice samples required a 5 mL volume measurement using a graduated cylinder, introducing additional error, the difference is very striking.
Comparing Set 3 and Set 4 in Table 2, the Sorbees candy %RSD value is very similar to the %RSD of the homogeneous KHP samples for a similar titration amount.
Conclusions: The scattering of Set 3 and Set 4 is very similar: the Sorbees candies are uniform in acid content. The scatter of Set 1 is much larger than that of Set 2: the Vicks candies are not uniform in acid content.
An explanation for the non-uniformity of the citric acid content of the Vicks hard-sugar lemon cough drops
Recipes retrieved online for making sour-lemon hard-sugar candy indicate that solid powdered citric acid is not added to the candy until after the candy has been made and is cooling down.5 This is like adding raisins to cookie dough, so the result is not a homogeneous mixture. Why not add the citric acid before making the candy? Hard-sugar candy making requires that the sugar-water mixture be boiled to evaporate off water until the temperature reaches 155-160ºC.6
The Wikipedia article on citric acid7 states that citric acid decomposes above 175ºC, so the citric acid must be added only after the candy has been made and then cooled somewhat. Otherwise, the citric acid would at least partially decompose, probably changing the taste or creating toxic products.
An attempt to confirm that the Vicks cough drops are made this way has been denied by Consumer Relations of Proctor and Gamble on the grounds that the information is “confidential or unavailable”. A similar request for information from Sorbees has not yet received a reply.
Questions for students
Looking at the recipe in Reference 5, you will see that it is possible to coat candy with a citric acid powder, creating a candy with an acid “jolt”. Design an experiment to distinguish between the citric acid as a powder on the surface of a hard candy from that inside the bulk of the candy.
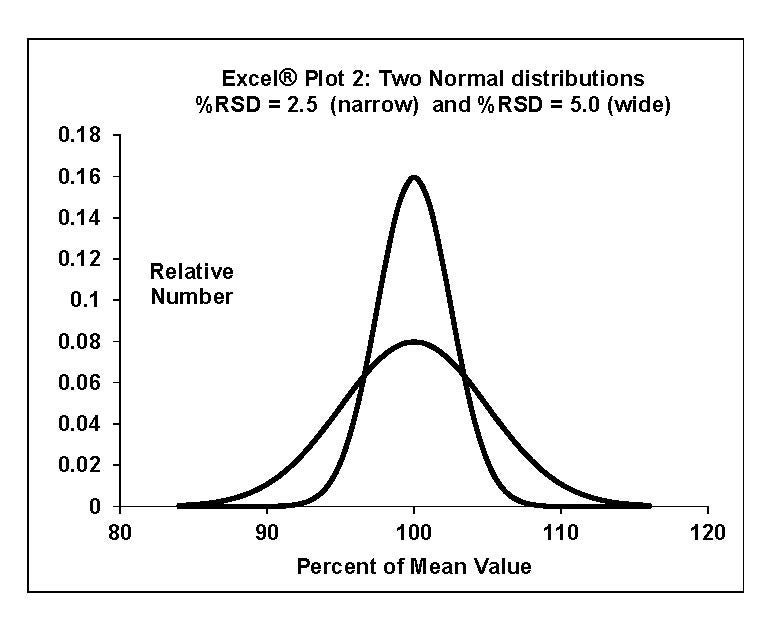
Determine the mass of tea in each of 10 tea bags of the same batch, typically 40 to 80 g of loose tea. Use Excel® to construct the data set and to create a plot similar to Excel® Plot 1 above. Use Excel® statistical functions to calculate the %RSD of the set, and create a normal distribution for the set similar to Excel® Plot 2 on next page. Reference 8 gives the instructions for this task.
Two sugar substitutes commonly used in candies and foods are maltitol and xylitol. Construct a comparison chart for sucrose, maltitol and xylitol with the following sections: chemical formula and structural formula; method of production; physical properties (melting point, boiling point, water solubility); nutritional properties (sweetness, Cal/g, glycemic index, etc.); dental properties with respect to oral bacteria; cost of production; relative pros and cons of use.
Acknowledgements
The author thanks Bill Rolfe, Fiona Anthony Waterton, and Randy Travis, the technologists of the Department of Chemical, Environmental, and Biotechnology of Mohawk College, for their invaluable help.
Notes
Refresher on comparisons using statistics: Assume that for each set, the analysis results are part of a normal distribution (see below Excel® Plot 2). Statistical functions use each set’s data to create a best-fit normal distribution and an estimate of the standard deviation of the set. Excel® statistical functions gave the mean and standard deviation of each set; the percent relative standard deviation (%RSD) of each set was calculated. The larger the %RSD, the more scattered the set.
%RSD = (standard deviation / mean) x 100%
References (all website accessed February 2014)
- Student labs available from the webpage: http://www.uclmail.net/users/dn.cash/articles.html
- Drop Count Titration (16.3 MB): http://www.uclmail.net/users/dn.cash/DropCountTitr.pdf
- Gravimetric Titration 3: (2.1 MB):
http://www.uclmail.net/users/dn.cash/GravTitr3.pdf
- Vicks Lemon Cough Drops: http://www.vicks.ca/en-ca/shop-products/vaporub/vicks-vapodrops
- Sorbees Sugar-Free Lemon Candy: https://mybrands.com/Brands/Sorbee-Sugar-Free-Hard-Candy---Sugar-Free-Lollipop/Sorbee-Sugar-Free-Hard-Candy-Lemon-10-lb
- LifeSavers Hard Candy Variety: http://www.life-savers.com/products#/collisions_tm_bag
- Kelso’s Candy Dish: http://kelsoscandydish.blogspot.ca/2011/05/lemonheads.html
- Today’s Chemist at Work: http://pubs.acs.org/subscribe/journals/tcaw/10/i12/html/12willis.html
- Wikipedia – Citric Acid: https://en.wikipedia.org/wiki/Citric_acid
- A Normal Distribution Graph in Excel: http://sciencing.com/create-normal-distribution-graph-excel-2684.html