


Contact
 Kevin Lamb Department of Applied Mathematics
![]()
 Ralph Smith Department of Biology
Introduction
Warmer air temperatures and changing winds are expected in the Laurentian Great Lakes region of North America over the coming decades, with important consequences for lake ecosystems and the problem of hypoxia (low oxygen conditions) in particular. Persistent hypoxia causes serious loss of ecosystem services and biodiversity. Climate warming is expected to strengthen thermal stratification in lakes and thus worsen hypoxia, an effect that could be compounded by weakening winds.
Lake Erie is a Laurentian Great Lake where hypoxia resulting from nutrient enrichment is a continuing concern. Nutrient loading alone, however, cannot explain the persistence and worsening of hypoxia in recent decades. Climate‐driven physical forcing is known to be an additional influence but the effects of anticipated climatic changes are not yet quantified. The objective of this study was to predict the response of hypoxia in Lake Erie to likely changes in climate (air temperatures and wind velocities) and nutrients (total phosphorus, TP) using a three‐dimensional hydrodynamic‐ecological model.
Methodology
Base case field data was collected in 2008 from various meteorological buoys, water quality mooring stations, and monitoring cruises on Lake Erie.
The numerical experiments were conducted using a coupled 3‐D hydrodynamic and ecological model ELCOM‐CAEDYM (ELCD). ELCOM simulates velocity, temperature, salinity, and tracers in lakes subjected to environmental forcing, including surface heating and cooling, wind stress, inflows, and outflows. ELCOM provides the hydrodynamic input for CAEDYM, an ecological model that simulates biogeochemical cycles and major components of the aquatic food web.
The computational grid had a 2 km horizontal resolution and 45 unevenly spaced vertical layers. The thermal structure was characterized spatially and temporally for varying regions by defining the epilimnion, thermocline, and hypolimnion in three dimensions. Hypoxia was defined to exist when dissolved oxygen (DO) concentrations were less than 2 mg L−1 at 1 meter above bottom (mab), and anoxia when DO concentrations were less than 1 mg L−1 at 1 mab. The hypoxia onset time was defined as the time when 10 per cent of the area became hypoxic for the first time at 1 mab, and the breakdown time as when 10 per cent of the area was hypoxic for the last time at 1 mab. The hypoxia duration was the length of time between the onset and breakdown times. The degree of hypoxia and anoxia was quantified with metrics that incorporated both areal extent and duration of DO depletion.
Simulations were run from April 21 to October 27 to assess the sensitivity of hypoxia and anoxia to changes in air temperature (±1°C, ±2°C, ±4°C), wind speed (±5%, ±10%, ±20%), and nutrient (TP) loads (+25%, −25%, −50%, and −75% of total P loading).
Outcomes
In the base 2008 case, the seasonal thermocline was well established by July. Hypoxia appeared in August, first in shallow regions where the hypolimnion - the cooler lower layer - became very thin. A large region of hypoxic water, covering nearly 50 per cent of the central basin, subsequently formed in deeper waters. By mid-October hypoxia was much reduced as thermal stratification broke down (Figure 1).
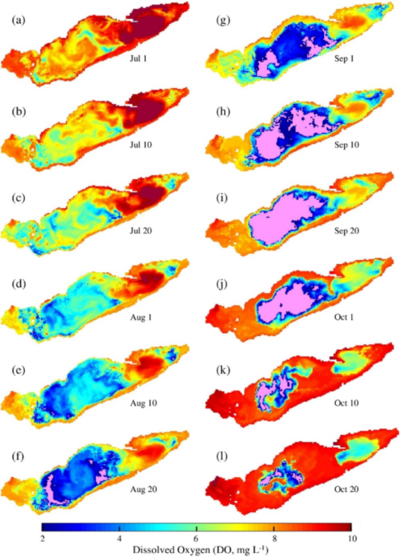
Figure 1: Simulated hypolimnion dissolved oxygen (DO; mg L−1) at 1 mab on selected dates for the base case. Pink color indicates DO concentrations <2 mg L−1.
Thermal stratification and hypoxia were predicted to be more persistent with higher air temperatures. Hypoxia started earlier and broke down later with higher temperatures, with a hypoxic period of 72 days in the warmest scenario, 49 days in the coldest and 66 days in base case. The spatial extent of hypoxia and anoxia increased with air temperature (Figure 2). The result was not only an increased hypoxic period, but also the appearance of hypoxia in shallower nearshore areas, where municipal water intakes are often located (Figure 3). The dynamics of the stratification and hypoxic areas showed strong correspondence between breakdown of stratification and end of hypoxia, as vertical mixing restored DO.
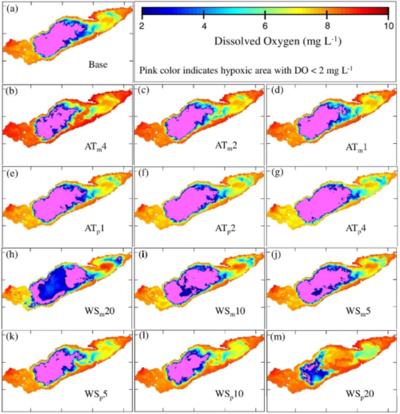
Figure 2: Simulated DO (mg L−1) on 20 September for the (a) base case scenario; (b–g) air temperature modification scenarios; and (h–m) wind speed modification scenarios.
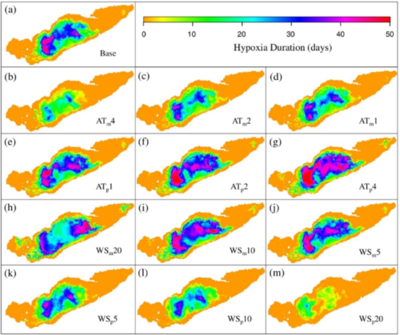
Figure 3: Duration of hypoxia (day) in the central basin for (a) base case scenario; (b–g) air temperature modification scenarios; and (h–m) wind speed modification scenarios.
Simulated wind variations had strong effects on predicted stratification and hypoxia. Stronger winds caused hypoxia to form earlier and to last for a shorter period of time because they deepened the thermocline and shortened the stratification period. Weakening of winds gave more persistent and spatially extensive hypoxia and anoxia.
Decreased nutrient loading was predicted to delay the dates for onset and maximum extent of hypoxia. Similarly, the duration and maximum area of hypoxia decreased as nutrient loading diminished. In the 75 per cent nutrient loading decrease scenario, both hypoxia and anoxia were essentially abolished.
Conclusions
The results give the first process‐based demonstration that independent changes in air temperature and wind speed rival TP loading changes in impacting hypoxia. The results were consistent with other evidence that increased air temperatures and nutrient loading cause more hypoxia in Lake Erie. A trend to calmer winds, as foreseen in some climate projections, was predicted to be similarly important. Over most of the relevant range of forcing factors, the simple and first‐order effect of a 1°C temperature change was equivalent to a 10–14 per cent change in TP loads, while a 1 per cent change in wind speed was equivalent to a 2–3 per cent change in TP loads. The results suggest that considerable additional control of nutrient loading will be needed to offset the likely climate effects in the 21st century.
The findings also supported more attention to metrics and thresholds for assessing hypoxia in aquatic ecosystems. Hypoxia has dimensions of area, duration, and intensity, while threshold DO concentrations for different ecological impacts vary. In Lake Erie and elsewhere, hypoxia has nonetheless been characterized mostly by its horizontal extent using a single hypoxic threshold (2 mg L-1). The results showed that other metrics, likely more representative of actual ecological impacts, are more sensitive to the modelled environmental changes. The more damaging condition of anoxia (< 1 mg L-1) was notably more sensitive to climate and nutrient variations than was hypoxia.
Preliminary results here indicated that loss of winter ice cover would further increase air temperature effects. Simulations with realistic treatment of multi-year effects including the winter season are a high priority for future work.
Bocaniov, S.A., Lamb, K.G., Liu, W., Rao, Y.R., & Smith, R.E.H. (2020). High sensitivity of lake hypoxia to air temperatures, winds, and nutrient loading: Insights from a 3‐D lake model. Water Resources Research, 56(12). doi:org/10.1029/2019WR027040
For more information about WaterResearch, contact Julie Grant.


