


Contact

Nandita Basu Departments of Earth and Environmental Sciences
and Civil and Environmental Engineering

Danyka Byrnes, Department of Civil and Environmental Engineering
Ruchi Bhattacharya, Department of Earth and Environmental Sciences
Roy Brouwer, Department of Economics
Philippe Van Cappellen, Department of Earth and Environmental Sciences
David Rudolph, Department of Earth and Environmental Sciences
Introduction
For the past century, nitrate pollution has grown together with increased populations and agricultural intensification. While billions of dollars have been invested to improve water quality, adequate progress has not been made. It is argued that one of the reasons for this lack of progress is the overuse of fertilizers resulting nitrogen (N) “legacies” that have accumulated in landscapes over decades and contribute to time lags in water quality improvements (Figure 1). This study synthesizes challenges and knowledge gaps that exist regarding N legacies and proposes strategies for managing water quality given the presence of these legacies.
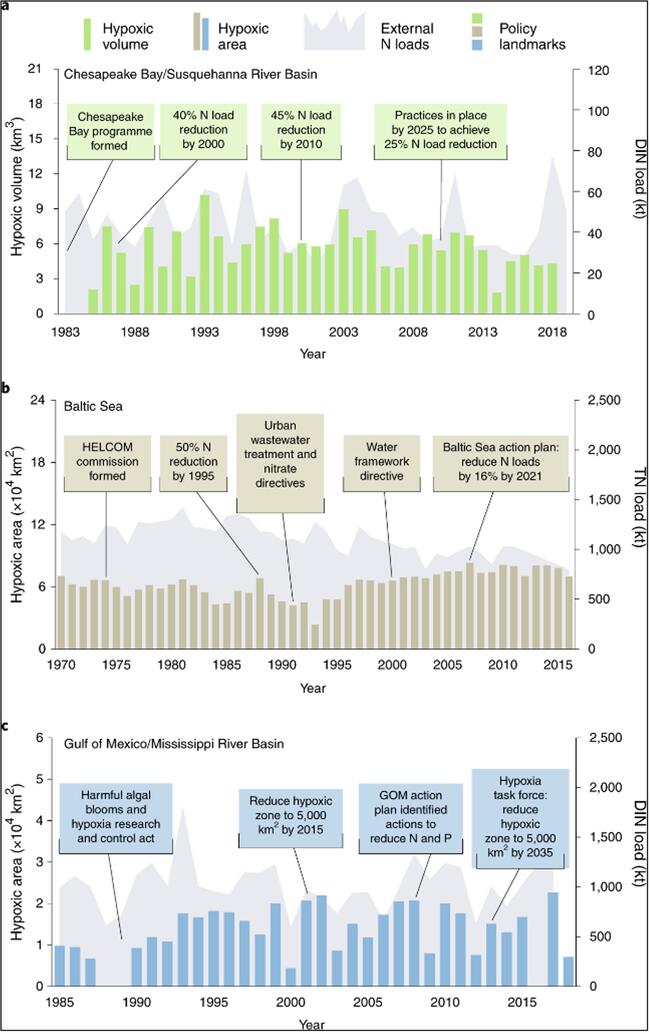
Figure 1: Time lines of policy measures and hypoxic-zone size
Time series for the hypoxic area or volume, the riverine N load and selected policy landmarks and goals for the Chesapeake Bay/Susquehanna River basin (a), Baltic Sea (b) and Gulf of Mexico (GOM)/Mississippi River basin (c).
Outcomes
Legacy N can accumulate in landscape elements, including soils, groundwater, reservoirs and lake and stream sediments, in various forms, including as dissolved nitrate in groundwater and soil water and as organic N in soils. Mass-balance studies can theoretically estimate the legacy mass as a function of N inputs (fertilizer N, manure N, atmospheric N deposition, biological N fixation, wastewater N) and outputs (crop N uptake, denitrification, riverine N export). The magnitude of denitrification is extremely difficult to quantify at the landscape scale and, until recently, has been used to close the N mass budget based on an underlying assumption that there is no legacy accumulation in the landscape. This assumption has been challenged by recent studies that have demonstrated evidence of organic N build-up in the soil profile and dissolved N build-up in the vadose zone and groundwater, however, there is a lack of quantitative understanding of the magnitudes of legacy N accumulated in the various environmental compartments and the timescales over which legacy N continues to leach into water bodies (Figure 2).
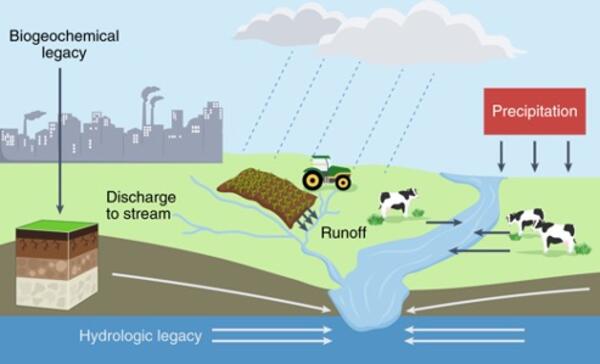
Figure 2: Transport and retention of N across human-impacted landscapes
Agricultural areas are N sources due to over-application of commercial fertilizers and livestock manure. N can be retained as biogeochemical legacy in agricultural soils in the form of organic N. N can also be retained in a dissolved form in groundwater as hydrologic legacy. N from current application, as well as legacy stores, is transported to lakes and coastal zones via overland flow as well as through riverine and subsurface transport pathways.
It is important to understand the relationship between N inputs to a watershed and N loads in streams exiting the watershed in order to set appropriate policy goals and management strategies. Traditionally, stream N loads have been conceptualized as being linearly correlated with net N inputs, with net N inputs being quantified as the difference between inputs and outputs. While some watersheds will demonstrate proportional decreases in annual N loads in response to unit decreases in N inputs, analysis of multi-decadal trajectories demonstrates that watersheds commonly exhibit nonlinear responses to decreases in N inputs. This nonlinearity can be described as a hysteresis effect, meaning that watershed N loads at any point in time are not just a function of current N inputs, but of the history of N inputs to that watershed over time. If net N inputs to a watershed have been high for decades, leading to an accumulation of N in soils, sediments and groundwater, N loading may remain elevated, even after decreases in inputs, due to a slow depletion of legacy N from the system (Figure 3).
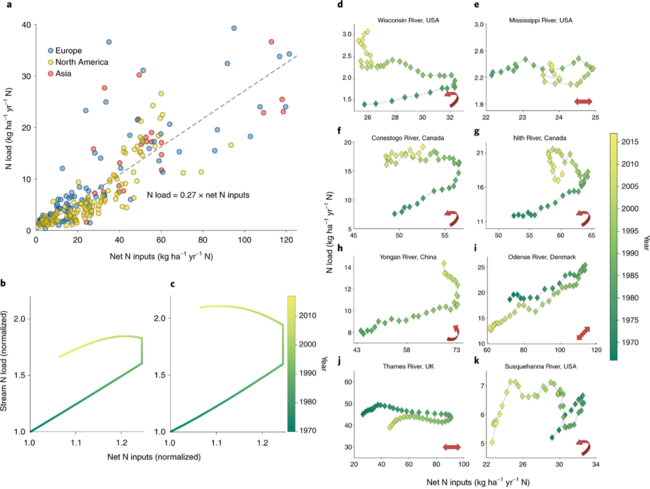
Figure. 3: Relationships between stream N loads and watershed net N inputs
a, Individual watersheds across Europe, North America, and Asia are positioned within the plot on the basis of net anthropogenic N inputs to the watershed and stream N loads. b,c, The ELEMeNT model was used to simulate changing relationships between N inputs and stream N loads over time. d–k, These plots represent changing relationships between N inputs and stream N loads over time for watersheds around the world. Arrows in the plot represent the direction of the hysteresis loop, with a wider anticlockwise loop indicating stronger legacy effects.
Quantification of watershed lag times, including their spatial variability within and across watersheds, is important for setting realistic policy goals and for choosing appropriate mitigation strategies. Statistical models generally assume the N cycle to be at a steady state and thus cannot account for legacy effects. Process-based models theoretically have the ability to capture legacy effects; however, they usually ignore historical inputs and thus legacy accumulation and depletion. Some progress in the modelling of watershed legacy N dynamics and lag times has recently been made. Statistical approaches, involving prediction of current-year N loads as a function of N inputs over the past few decades, have been developed to capture lag times in the Mississippi River basin and the Yongan watershed in China. The number of process-based models that consider legacy processes is limited and includes the Exploration of Long-tErM Nutrient Trajectories (ELEMeNT) model, the nitrate time bomb model to estimate groundwater nitrate concentrations, the watershed-scale LM3-TAN model and SWAT-LAG.
Development of economically efficient water quality improvement strategies requires analysis of costs, benefits and effectiveness that take legacy effects into account. a challenge in carrying out such analyses is that most of the approaches weigh short-term costs and benefits higher than long-term improvements in water quality. Two general categories of tools are used for carrying out cost–benefit analyses of water quality policies: integrated assessment models (IAMs) and econometric approaches. IAMs couple economic and ecological models to describe emission of pollutants, their transport through the landscape, outcomes of the pollutants and the valuation of these outcomes. The flexibility of IAMs makes them ideal for use in analyzing potential regulatory policies, however, pollutant transport modules in most IAMs do not consider legacy effects. Legacy effects are also not considered in econometric approaches, which are based on empirical water quality data and involve the use of regression models to evaluate the effects of past policies on water quality.
The scientific understanding of time lags has not been adequately translated to policy, where there exists an expectation of short-term improvements in water quality similar to those experienced after implementation of point-source control measures. The very different timescales of response for point-source versus non-point-source pollutants is not often appreciated. Effective water quality policy is also confounded by two key challenges: 1) a lack of measured data at appropriate scales; and 2) voluntary measures often have low adoption rates while more prescriptive measures can lead to dissatisfaction.
Conclusions
The study identified six strategies to improve watershed management and planning given the critical role of legacy N in delaying water quality improvements.
Strategy 1—quantify lag times and adjust expectations
To address uncertainty on how lag times vary across the landscape, it is important to 1) provide estimates in various landscapes using a combination of field data and modelling and 2) develop methodologies to communicate lag times to stakeholders.
Strategy 2—legacy as a resource
The effective use of N legacy stores together with lower fertilizer application rates can contribute to lower N fluxes to streams without sacrificing crop production. The ability of stores to sustain crop yields would vary spatially as a function of soil and crop type, topography, land use history and climate drivers.
Strategy 3—spatial targeting of watershed conservation measures
Conservation practices are often promoted and applied broadly without regard for differences in agricultural practices or legacy-related risks and opportunities. Spatially and temporally targeting practices is a cost-effective and efficient means of minimizing trade-offs between agricultural production and water quality.
Strategy 4—couple field-scale and downstream measures to minimize lag times
N legacies can accumulate in the soil or groundwater. While reducing fertilizer application can result in crops accessing soil N legacies, addressing groundwater legacies requires downstream controls such as wetlands, reservoirs or riparian buffers that intercept groundwater flow pathways. A strategic combination of watershed conservation measures that address both soil and groundwater legacies can lead to the fastest watershed response times.
Strategy 5—diversify monitoring to evaluate outcomes and inform adaptive management
Successful adoption of watershed management practices is strongly dependent on public perception of their efficacy. Given the existence of N legacies, and potentially long time-lags to achieve measurable water quality benefits at larger scales, it is important to quantify the efficacy of practices at a multitude of scales. Impacts will be apparent at some scales earlier than others and these initial successes (or failures) can be used to inform adaptive watershed management.
Strategy 6—better incorporate assessments of both long-term and short-term benefits into economic analyses
Current economic assessments of water quality policy are often flawed due to assumptions of immediate benefits in response to implementation of improved management practices. Economic tools, such as cost–benefit analyses, must be modified to account for N legacies and time lags, while hydro-economic modelling approaches need to include estimates of the time required to achieve water quality benefits through the coupling of economic models with process-based water quality models that take N legacies into account.
Basu, N.B., Van Meter, K.J., Byrnes, D.K., Van Cappellen, P., Brouwer, R., Jacobsen, B.H., Jarsjö, J., Rudolph, D.L., Cunha, M.C., Nelson, N., Bhattacharya, R., Destouni, G., Olsen, S.B. (2022). Managing nitrogen legacies to accelerate water quality improvement. Nature Geoscience. https://doi.org/10.1038/s41561-021-00889-9
For more information about WaterResearch, contact Julie Grant.


