


Contact

 Stephen Evans, Department of Earth and Environmental Sciences
 Nahyan Rana, Department of Earth and Environmental Sciences
Introduction
Engineered dams have vast spatial footprints in countries and landscapes across the world. These impoundments include i) water-retention dams or reservoirs built for irrigation, flood control, water supply, hydroelectric power generation or other purposes and (ii) tailings storage facilities built to contain fine-grained, wet, environmentally hazardous sediments that are by-products of mineral extraction operations. While the principal requirement for engineers when designing and operating these structures is to ensure safety, catastrophic failures have resulted in significant human, economic and environmental consequences. Such failures have raised concern about the long-term safety of engineered impoundments in an era of climate change, heightened public pressure, population growth and increased resource demands.
The performance and safety of engineered dams can be inferred by examining historical magnitude-frequency statistics of failures and resulting human and environmental consequences. However, such global statistics remain poorly quantified, out-of-date or limited in scope. This study addresses that gap by a comprehensive review of existing databases and published estimates and by the use of statistical extrapolation and estimation approaches to fill data gaps. The study quantifies the magnitude-frequency distributions and the cumulative failure and fatality rates of large reservoir facilities (LRFs) and tailings storge facilities (TSFs) worldwide for the period 1965 to 2020. These statistics provide insight into how the risk associated with impoundments has evolved over time and provide quantitative benchmarks for estimating the likelihood of failures and associated societal and environmental impacts.
Methodology
The study focused on the period from 1965 to 2020 for statistical analyses because the mid-1960s i) were critical for LRF and TSF engineering following several significant failures and ii) marked the advent of satellites which allowed for the mapping and documentation of failures. Published datasets and statistical studies were used to estimate annual and cumulative LRF and TSF construction and failure totals. Different assumptions and scaling and extrapolation approaches were adopted to obtain upper- and lower-estimates for both variables. A key challenge to estimate cumulative rates was a lack of data on LRF failures in China and the number of constructed TSFs worldwide. Figure 1 summarizes the data collection process, the adopted estimation and extrapolation approaches and the associated uncertainties.
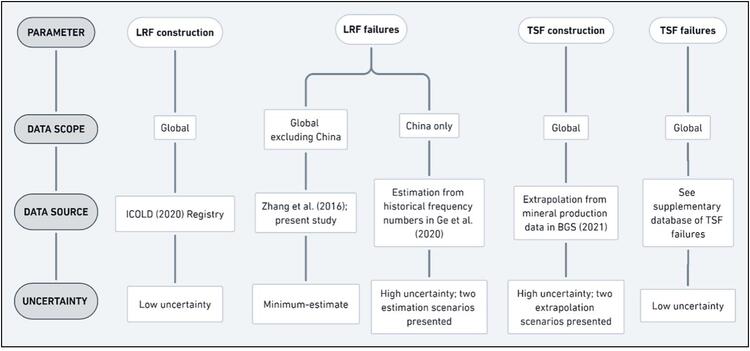
Figure 1: Summary of the data collection, estimation, and extrapolation approaches and the associated uncertainties.
Outcomes
The study estimated that 33,424 LRFs were constructed worldwide from 1965 to 2020, with the annual rate of construction having declined by over 90 per cent since its peak in the 1970s. The total storage capacity of LRFs was about 1.1 × 10¹³ m3, or almost the volume of Lake Superior (Figure 2). The total number of LRF failures worldwide in this period was estimated to be between 394 and 608 (Figure 3). The cumulative number of fatalities caused by LRF failures was about 40,100. The magnitude-frequency distribution of LRF failures indicated that the recurrence rate of high-magnitude LRF failures and of fatal LRF failures reduced over the study period.
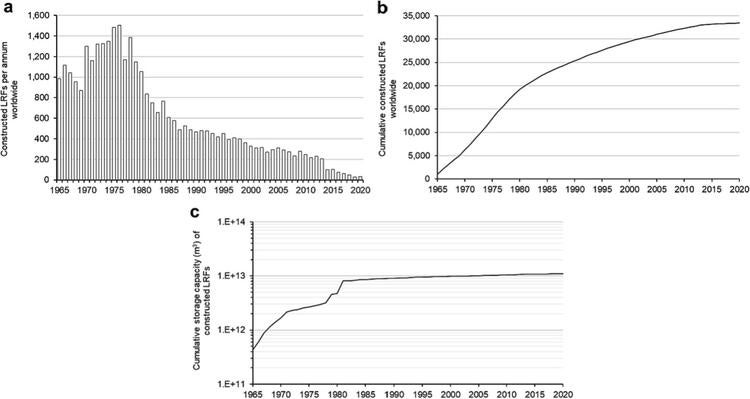
Figure 2: Constructed LRFs worldwide from 1965 to 2020. [a] Number of newly constructed LRFs per annum worldwide. [b] Cumulative number of newly constructed LRFs worldwide. [c] Cumulative sums of storage capacities of newly constructed LRFs.
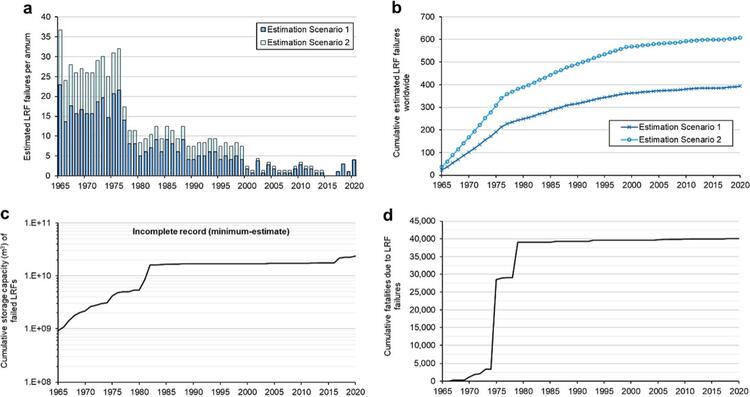
Figure 3: Estimated LRF failures worldwide from 1965 to 2020. [a] Estimated annual number of LRF failures. [b] Cumulative estimated number of LRF failures. [c] Cumulative sums of storage capacities of LRF failures. [d] Cumulative number of fatalities caused by LRF failures.
The study estimated the number of constructed TSFs worldwide from 1965 to 2020 was above 6,810 and closer to 20,230 (Figure 4). Both methods suggested that the annual rate of TSF construction increased worldwide by approximately fourfold over the study period. By 2020, the global volume of produced tailings was estimated to be 2.5 × 10¹¹ m3, or almost the volume of Lake Winnipeg (Figure 4). The total number of reported TSF failures in this period was 303 (Figure 5), with the annual frequency of TSF failures having been relatively constant. Of 285 of these cases, 89 had localized impacts, 110 had off-site geochemical impacts and 86 had off-site physical and geochemical impacts (Figure 5). The cumulative number of fatalities resulting from TSF failures was 2,024. The magnitude-frequency distribution of TSF failures indicated mean return periods for TSF failures with released volumes of ≥ 1 M m3 and ≥ 5 M m3 of about 1.5 years and 7 years respectively.
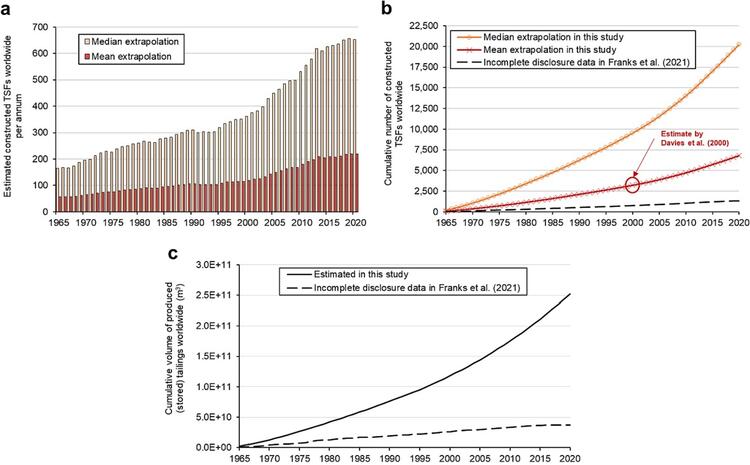
Figure 4: Estimated construction rate of TSFs worldwide for the period 1965 to 2020. [a] Annual numbers of constructed TSFs. [b] Cumulative number of constructed TSFs. [c] Estimated cumulative volume of produced (stored) tailings worldwide in comparison to 5-year planned storage volumes for 1,336 publicly disclosed TSFs.
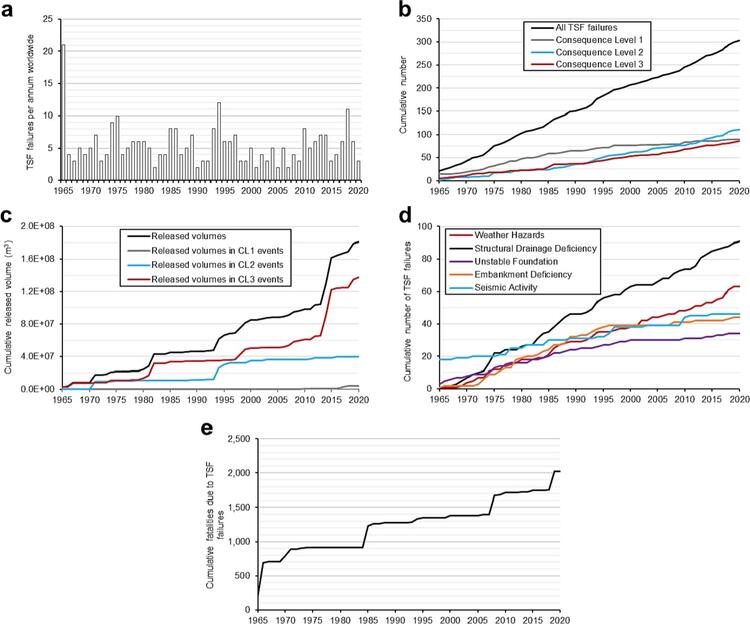
Figure 5: Reported TSF failures worldwide for the period 1965 to 2020. [a] Annual numbers of reported TSF failures. [b] Cumulative number of reported TSF failures. [c] Released volumes from failed TSFs. [d] Cumulative number of reported TSF failures according to causative variables. [e] Cumulative number of fatalities due to TSF failures over the study period.
The study estimated that the cumulative failure rate of LRFs stayed fairly constant between 1.2 and 1.8 per cent over the period 1965 to 2020 (Figure 6). This rate dropped to about 0.7% when failures in China were excluded. Failures of LRFs with very high storage capacities (>200 million m3) continued to occur since 2016 (Figure 7). The cumulative fatality rate declined over the study period to 1.2 deaths per constructed LRF or 64 to 98 deaths per LRF failure (Figure 8).
The study suggested that the cumulative failure rate of TSFs was below 4.4% and closer to 1.5%, which falls in the same order as the corresponding rate of LRFs (Figure 6). However, the study found that the global average released volume from failed TSFs rose at a rate roughly proportional to the estimated increase in the global rate of produced tailings, and that the downstream impacts resulting from TSF failures increased on average worldwide especially since 2014 (Figure 7). The cumulative fatality rates were estimated to be 0.1 to 0.3 death per constructed TSF and 6 deaths per TSF failure as of end-of-2020 (Figure 8).
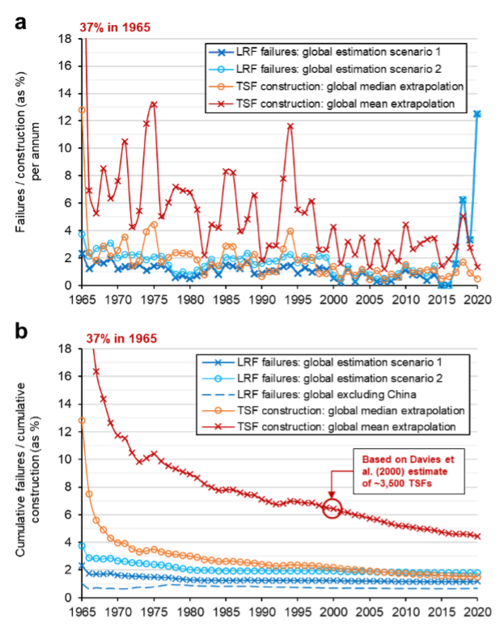
Figure 6: Normalized estimated failure rates for LRFs and TSFs worldwide in the period 1965-2020 [a] Annual rates of the number of failures per the number of constructed facilities for both LRFs and TSFs. [b] Cumulative rates of the cumulative number of failures per the cumulative number of constructed facilities for both LRFs and TSFs.
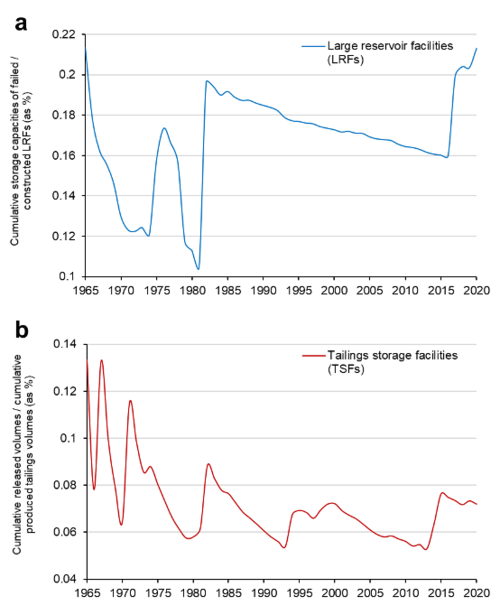
Figure 7: [a] Cumulative rates of the cumulative storage capacities of failed LRFs per the cumulative storage capacities of constructed LRFs based on minimum-estimate data in the period 1965-2020. [b] Cumulative rates of the cumulative released volumes of failed TSFs per the cumulative produced volumes of tailings in the period 1965-2020.
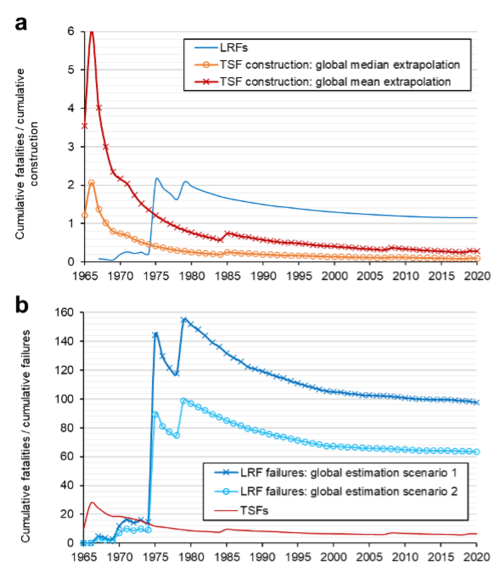
Figure 8: Cumulative fatality rates of LRFs and TSFs estimated as annual rates of cumulative fatalities per [a] cumulative constructed facility and [b] cumulative failures in the period 1965-2020.
Conclusions
The failures of engineered dams that retain freshwater or mining waste (tailings) have led to major socioeconomic and environmental consequences. This study presented an analysis of new datasets and estimates of the construction and failures of LRFs and TSFs worldwide during the period of 1965 to 2020.
The study found that annual numbers of LRF construction and failures have declined almost proportionally while the cumulative fatality rate of failures has reduced over time perhaps attributable to systematic, incremental improvements in dam safety programs and risk assessment and management frameworks. However, major failures of LRFs with very high storage capacities have continued to occur. In contrast, the annual number of TSF failures has stayed relatively constant while the annual construction rate has increased leading to a declining cumulative failure rate that falls in the same order as the corresponding rate of LRFs. However, the size and the environmental impact of TSF failures has increased on average at a rate approximately proportional to the increased global rate of tailings production. A key difference between LRF and TSF failures is the long-term fate and extreme geochemical consequences associated with downstream tailings flow deposits. More frequent and intense rainfall events are statistically important causative variables for the failures of both LRFs and TSFs and have implications for the design and management of storage capacity, freeboard, facility drainage and spillways under changing climatic conditions.
The study results provide quantitative benchmarks for hazard and risk assessments of LRFs and TSFs applicable on a global scale. To improve the robustness of future statistical analyses, more comprehensive public disclosures, particularly with respect to reservoir facility failures in China and constructed TSFs worldwide, are required.
Rana, N. M., Ghahramani, N., Evans, S. G., Small, A., Skermer, N., McDougall, S., Take, W. A. (2022) Global magnitude-frequency statistics of the failures and impacts of large water-retention dams and mine tailings impoundments. Earth-Science Reviews, Volume 232. https://doi.org/10.1016/j.earscirev.2022.104144
For more information about WaterResearch, contact Julie Grant.
Banner Photo: Examples of recent high-profile failures of water reservoir dams and mine tailings dams: [a] 2020 Sardoba, Uzbekistan; [b] 2020 Edenville, USA; [c] 2014 Mt. Polley, Canada; and [d] 2019 Feijao, Brazil. The circles indicate the dam breach location.


