


Contact

Jason Thistlethwaite
School of Environment, Enterprise and Development

Guneet Sandhu
School of Environment, Enterprise and Development

Introduction
Water is a complex resource that provides critical social, economic, cultural and ecological functions that support human wellbeing, economic development and environmental sustainability. These functions are increasingly at risk due to factors, often exacerbated by climate change, that affect the availability, quality and accessibility of water over time and space. As risk influences a system's ability to respond and adapt, risk assessment and analysis is a central component of sustainable water management. While academic, policy and practitioner interest water risk assessment are growing, there remains a gap for systems-based, social-ecological frameworks.
The Province of Ontario, Canada is often perceived as water abundant, but does have local water challenges. The objective of this Ontario case study was to develop and apply an interdisciplinary water risk assessment framework using quantitative and qualitative water risk data at the subwatershed scale to inform sustainable water management decisions, policies, and practices. In addition, it was hoped that the study framework could be methodologically generalized as a model for other geographical regions.
Methodology
The study developed a theoretical framework to integrate biophysical and social variables (Figure 1) for water risk assessment and management. The assessment stage of the framework was then applied to 38 subwatersheds in Ontario (Figure 2) using two stage secondary quantitative and qualitative data analysis.
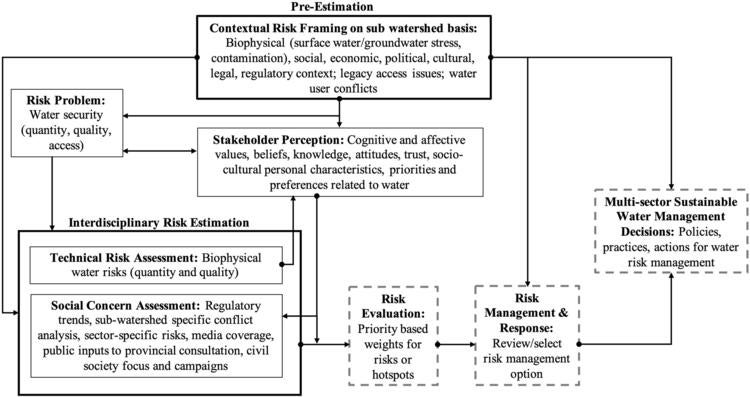
Figure 1: Framework for water risk assessment and management
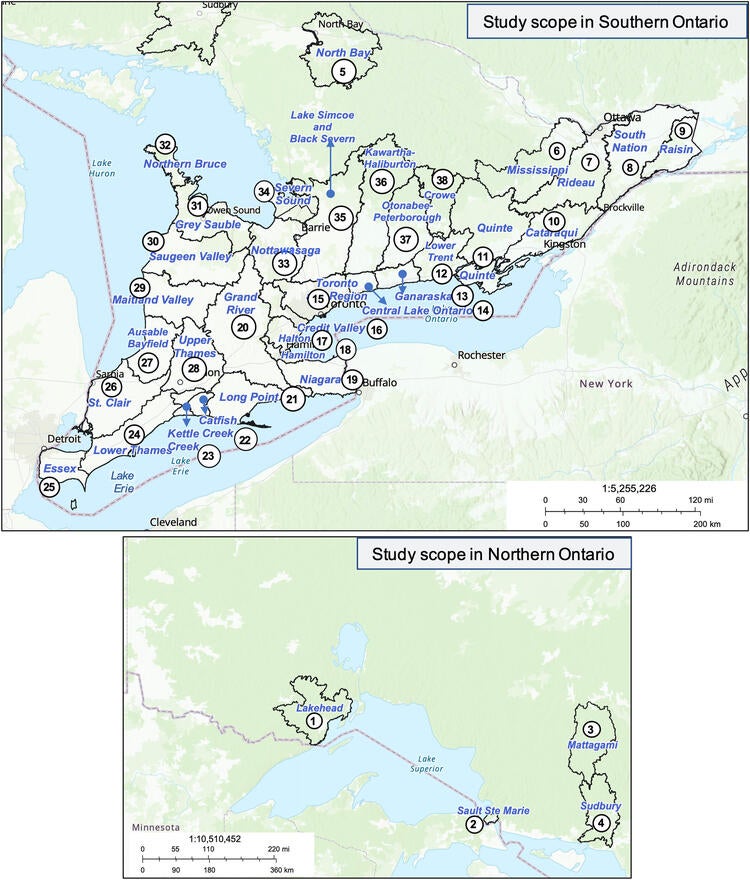
Figure 2: Study subwatersheds in Ontario, Canada
Six water risk indicator databases were developed for each subwatershed based on secondary data. The selection of sub-indicators was conceptually informed by the literature and theoretical framework (Table 1). In the second stage, sub-indicators were measured in categorical values on a binary scale of Yes/No, ordinal scales such as High/Moderate/Low or counts. Categorical values were converted into numerical values before aggregating cumulative risk scores. Scores were then converted to differentiated risk ratings for each subwatershed or sector.
Table 1: Water risk indicators and sub indicators
|
Risk Indicators |
Risk Sub-indicators |
|---|---|
|
Biophysical Water Quantity Risk |
|
|
Biophysical Water Quality Risk |
|
|
Regulatory Trends |
|
|
Public concern and perception of water issues and news media coverage |
|
|
Water-user conflict potential and legacy access issues |
|
|
Sector-specific risk assessment |
|
Outcomes
The study found that 50% and 66% of the investigated subwatersheds had at least one quaternary watershed at high and moderate surface water quantity stress respectively, while 55% and 63% had at least one quaternary watershed at high and moderate groundwater quantity stress respectively. The analysis found 63% of the subwatersheds had a very high and high water quality risk rating (Figure 3).
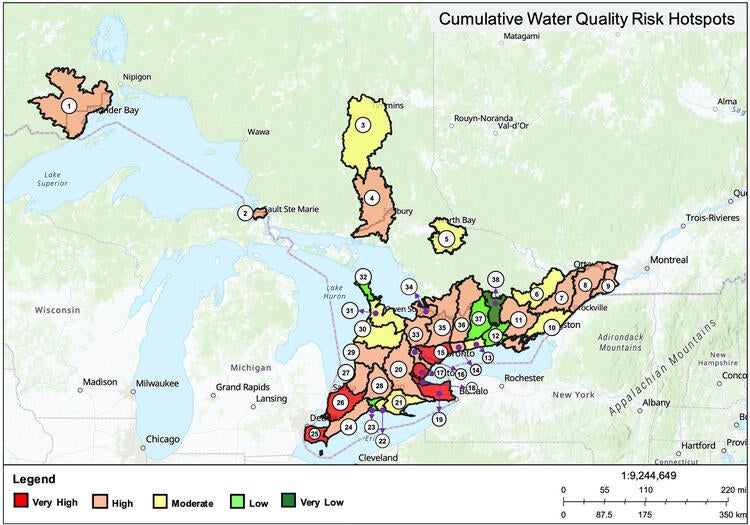
Figure 3: Cumulative water quality risk ratings
The study found that all 12 regulatory risk drivers were present, 33% at high prevalence and 67% at moderate prevalence, in the Provincial and Federal water management framework (Table 2).
Table 2. Regulatory trend assessment results
|
Prevalence rating |
Regulatory risk drivers |
|---|---|
|
High prevalence |
|
|
Moderate prevalence |
|
|
Low prevalence |
|
Eighty-two percent of the subwatersheds were found to be at very high and high conflict potential (Figure 4). Out of 70 water-using sectors, 50% were found to be at very high and high risk, 31% at moderate risk and 19% at low and very low risk (Table 3).
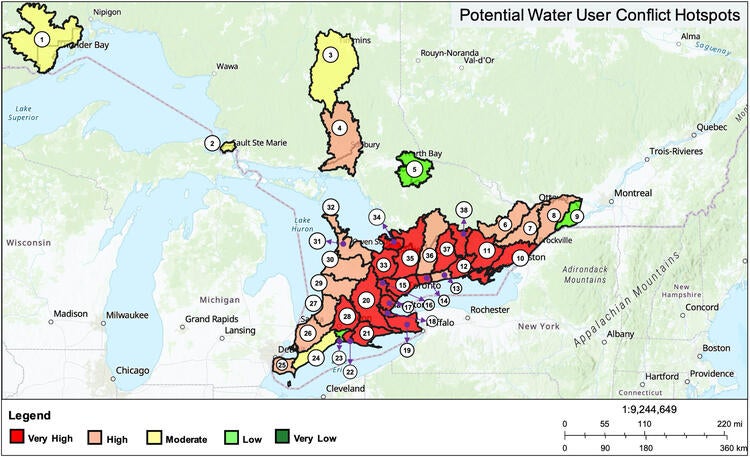
Figure 4: Water-related conflict potential ratings
Table 3. Results of sector-specific water risk assessment
|
Risk and Impact Rating |
Water using sectors |
|---|---|
|
Very high |
|
|
High |
|
|
Moderate |
|
Based on a thematic analysis of news media coverage, key water issues included:
- Unsafe drinking water in First Nations communities;
- Great Lakes water quality issues and protection initiatives;
- Regulatory changes and water governance issues;
- Potential negative impacts from industrial extraction/discharge and oil pipelines;
- Nuclear waste burial;
- Droughts and low flow conditions;
- Groundwater management issues (i.e., quantity and contamination);
- Intra-basin and inter-basin bulk water transfer pipelines;
- Privatization and commoditization of water;
- Overarching threats to water security (e.g., climate change, population growth, urban development);
- Infrastructure issues (e.g., lead, leaky pipes, insufficient wastewater treatment, combined sewer outflows).
Conclusions
The study advanced water risk assessment by applying social-ecological perspectives, interdisciplinary approaches to risk theory and mixed methods to provide a comprehensive evaluation of water security. The study revealed multiple hotspots for biophysical and social risk categories across the Great Lakes watershed. Results indicated that while water quantity stress varies across Ontario, water security risks tend to be equally driven by the multidimensional aspects of water quality, regulatory stringency and public perception. The study suggested that, considering all risk indicators, the overall water security risk for a subwatershed can deviate from those indicated by highly aggregated assessments.
The study found high and moderate risk potential in at least 50% of the investigated subwatersheds under all water risk categories, empirically challenging the myth of water abundance in the Great Lakes watershed in Ontario. The interdisciplinary water risk assessment framework developed can help integrate water risks in multisector decisions, policies, and practices supporting a more water secure and climate-resilient society and economy. While spatially scoped to populous subwatersheds of Ontario, this framework can be methodologically generalized to other geographical regions by using local data.
Read more in Water Resources Research
Sandhu, G., Weber, O., Wood, M. O., Rus, H. A., Thistlethwaite, J. An Interdisciplinary Water Risk Assessment Framework for Sustainable Water Management in Ontario, Canada. Water Resources Research, May 2023. https://doi.org/10.1029/2022WR032959
For more information about WaterResearch, contact Julie Grant.


