


 Wetlands are unique and increasingly important natural systems, providing a more than proportionate level of ecosystem services relative to their land area. Despite their ability to mitigate floods, retain nutrients, and provide productive habitats, significant areas of wetlands have been impaired or lost to other land uses over past decades. While many restoration and reclamation efforts have occurred, it has proven difficult to reconstruct the natural ecological structure and function of wetlands in isolation from their surrounding landscape.
Wetland reclamation guidelines often focus on biota and recommend gentle slopes and irregular shorelines, leading to the homogenization of wetlands and wetlandscapes (large-scale areas comprising multiple wetlands) that lack natural topographic variation and pattern. Successful reclamation eff orts need to be integrated with the surrounding landscape, as topography significantly influences natural processes such as the hydrologic function of wetlands. As such, the adoption of benchmarks that facilitate the replication of topographic characteristics would increase the potential for success.
In this study, we develop a methodology to quantify the spatial pattern and characteristics of topography in landscapes with an abundance of wetlands. More specifically, we address the degree to which topographic characteristics differ by natural region, and along a gradient of human disturbance. Unlike other applications of the reference condition approach, no benchmarks have been established for topographic landform elements or topographic variation in wetlandscapes.
Methodology
The study focused on wetlandscapes of the Grassland, Parkland and Boreal natural regions of Alberta, Canada, and comprised an area covering almost 28 per cent of the province. To quantify topographic characteristics and variation in elevation in wetland areas, the analysis was divided into six conceptual steps (Figure 1). We grouped over 3,000 1 km2 sample landscapes into 15 groups comprising five levels of disturbance across three natural regions (Table 1).
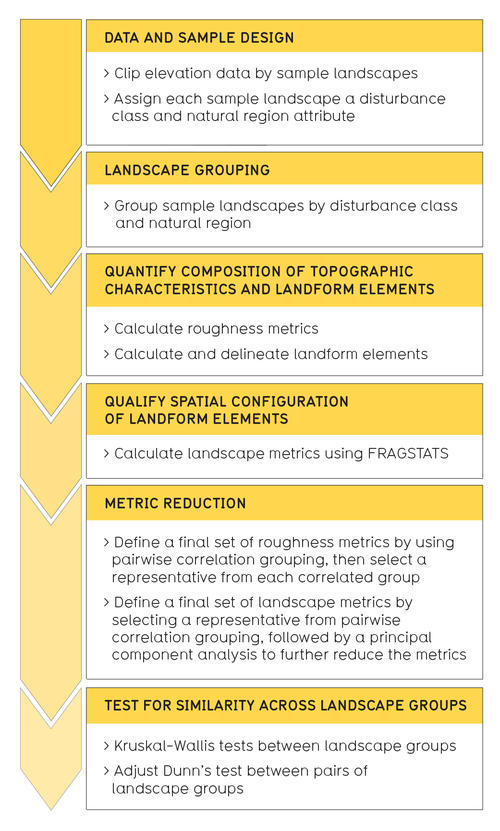
FIGURE 1: Key analysis steps
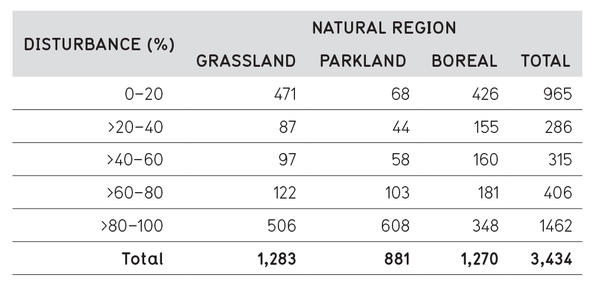
TABLE 1: Total number of landscapes by natural region and disturbance intervals
With these sample landscapes, we identified and computed metrics to quantify the continuous variability of the roughness of the terrain. To better understand the spatial patterns of topography, we used a discrete, rule-based approach to classify wetlandscapes into 12 landform elements based on calculated terrain metrics, such as slope, profile curvature, and plan curvature:
› Divergent Shoulder
› Planar Shoulder
› Convergent Shoulder
› Divergent Backslope
› Planar Backslope
› Convergent Backslope
› Divergent Footslope
› Planar Footslope
› Convergent Footslope
› Low Level
› High Level
› Depression
To quantify the composition and configuration of landform elements, and to characterize topographic patterns by natural region and disturbance level, landscape metrics were applied to sample landscapes using FRAGSTATS.
Outcomes
Each sample landscape’s topography was classified using these 12 discrete landform elements and was grouped based on the expected overland flow characteristics. In general, low and high-level landform elements, which are flat ground located below or above the average landscape elevation, were the most prevalent elements across all landscapes, while convergent backslope and convergent footslope elements were the least prevalent.
Five representative terrain roughness metrics were selected based on an iterative correlation analysis: focal slope variability, global slope variability, 2D:3D area ratio, global deviation from mean elevation, and focal inverse vector dispersion. Thirty-two landscape metrics were subsequently reduced using another iterative correlation analysis, resulting in 15 representative metrics for the Boreal and Grassland regions, and 14 metrics for the Parkland region. We then applied Principal Component Analysis which yielded a set of five landscape metrics for the entire study area, four landscape metrics for each natural region, and a total of seven unique metrics.
Results of the spatial analysis show that terrain roughness was statistically different between the Grassland, Parkland and Boreal natural regions in Alberta. However, these differences were less systematic across disturbance levels. We speculate that this lack of differentiation is due to the flattening of topography through agricultural, urban, and transportation land uses which creates an overwhelming difference between landscapes with 80-100 per cent disturbance compared to landscapes with less than 80 per cent disturbance. Figure 2 demonstrates how the diversity in landform elements and slope variability (a measure of surface roughness) change with increasing disturbance in six landscapes from the Boreal natural region.
The landform element analysis identified seven unique landscape pattern indices that can be used to quantify landform patterns in wetlandscapes. Analysis of the indices yielded similar results to the surface roughness results, namely that significant differences were found between natural regions. While in the Grassland and Parkland regions high levels of disturbance (80-100 per cent) produced landscapes with significantly different patterns than those with less than 80 per cent disturbance, the Boreal region results identified greater sensitivity among patterns of landform elements to differences in disturbance levels.
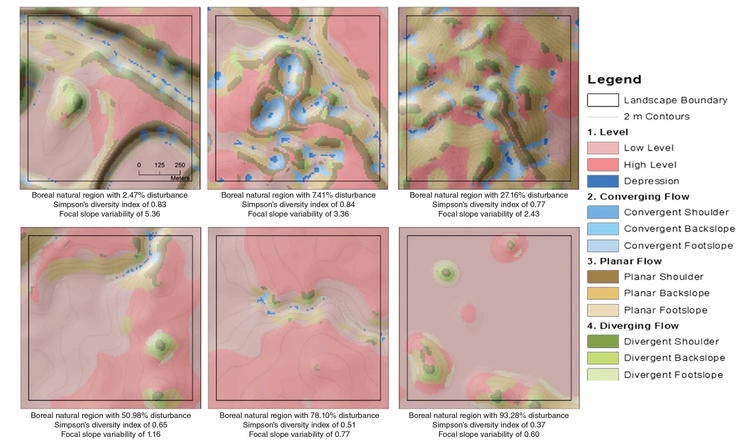
FIGURE 2: Example of landform element pattern and associated topographic roughness for landscapes across all five disturbance levels. Landscapes increase in disturbance from left-to-right, starting at the top left and exemplify how low disturbance wetlandscapes have greater landform diversity relative to high disturbance wetlandscapes.
Conclusions
Successful reclamation of wetlandscapes requires integration with surrounding landscapes, of which topography is a key component. This study identified an independent set of five surface roughness metrics and seven landform element pattern metrics that can statistically differentiate the terrain of landscapes in different natural regions, and between high disturbance landscapes (80-100 per cent) and those with less than 80 per cent disturbance. These metrics can be applied to landscapes to statistically compare topographic characteristics and define baseline topographic characteristics.
The observed values for each metric, by natural region and disturbance level, can be used as a lookup table to guide reclamation planning and design by industry. Alternatively, the distribution of values can be used by regulators to evaluate reclamation closure plans to ensure that resultant landscapes fall within the range of topographic characteristics found in natural landscapes. Oversight is required, however, to ensure that the aggregation of reclaimed landscapes represents the distribution of the study’s metric values, thus representing natural topographic variability.
Future research should focus on quantifying the covariation among various biophysical components of wetlandscapes, for example, topography, hydrology, solar radiation, and vegetation diversity, to improve the probability of reclamation success.
Branton, C., & Robinson, D.T. (2019). Quantifying topographic characteristics of wetlandscapes. Wetlands. doi.org/10.1007/s13157-019-01187-2.
Contact: Derek Robinson, Department of Geography and Environmental Management
For more information about WaterResearch, contact Julie Grant.


