


 Contact
 David Rudolph, Department of Earth and Environmental Sciences
 Andrew Wiebe, Department of Earth and Environmental Sciences
Introduction
Estimating groundwater recharge is challenging. With the emergence of regional or watershed scale groundwater models, the seasonality and spatial variability of recharge has become a hydrologic component of significant importance. Recharge is frequently estimated using a water balance approach, where its magnitude is calculated as a residual after accounting for the other measured or estimated water budget components. The rainfall data required for water budget estimations are often derived from local weather stations that vary in spatial proximity to the study area.
The objective of the study was to assess the spatial correlation among rainfall point measurements, and to explore the sensitivity of modelled recharge estimates to spatial variations in rainfall in a typical watershed in southern Ontario, Canada. It was hypothesized that recharge estimates in scenarios employing different rainfall networks’ interpolated data would differ to a degree that could significantly impact regional water management decisions.
Methodology
The Alder Creek watershed (78 km2) is located within the Grand River watershed (6,700 km2) and is adjacent to the cities of Kitchener and Waterloo, Ontario. The watershed’s glacial sands and gravels facilitate recharge for municipal well fields in an area where agricultural activities and urban expansion present challenges to water quality and quantity. Three sources of rainfall data were used: 1) national data (Roseville station), 2) regional data from six stations operated by the Grand River Conservation Authority, and 3) local data from the Alder Creek field observatory.
Spatial rainfall correlation between pairs of stations was assessed using Spearman’s rank correlation coefficient. The MIKE SHE hydrologic model was used to explore the sensitivity of recharge estimates to spatial variation in rainfall. Simulations using national, regional, and local watershed rainfall values were conducted for 2014, 2015 and 2016, respectively. None of the three simulations were calibrated, as each set of input data would result in a different calibrated model and obscure the effects of the input rainfall data on recharge rates. Results were compared based on maps of the spatial distribution of total recharge, the frequency of cell-by-cell differences in total recharge, the visual match between observed and modelled cumulative streamflow, and differences in annual water budget components.
Outcomes
The spatial correlation of rainfall was found to vary substantially at both regional and local scales, indicating that: (1) a single rain gauge may be insufficient to represent annual local rainfall for the watershed, and (2) the local network is providing additional rainfall information not captured by the regional network.
Uncertainty (±100 mm) calculated from an annual vadose zone water budget provided a metric for the differences in recharge between rainfall scenarios. Table 1 shows precipitation and recharge amounts for the three scenarios. The average total precipitation driving the water budget differed by up to 199 mm between scenarios, while differences in average recharge varied up to 141 mm per year, or 44 per cent of average steady state recharge. The differences related to Scenario 3 were greater than the uncertainty metric for both comparisons in 2014, and for the comparison with Scenario 2 in 2015.
|
Year |
Component |
Scenario |
||
|
1 National |
2 Regional |
3 Local |
||
|
2014 |
Average precipitation |
849 |
895 |
1048 |
|
Average recharge |
421 |
456 |
562 |
|
|
2015 |
Average precipitation |
789 |
714 |
897 |
|
Average recharge |
288 |
241 |
364 |
|
|
2016 |
Average precipitation |
879 |
756 |
771 |
|
Average recharge |
344 |
285 |
349 |
|
Table 1: Numerical model recharge results and comparisons (results in mm per m2 per year).
Figure 1 shows the spatial distribution of the recharge rates for the three rainfall scenarios. The 2014 maps (a, d and g) show similar recharge distributions for Scenarios 1 and 2, and higher recharge rates everywhere except near the stream channels for Scenario 3. The 2015 maps (b, e and h) particularly show differences in recharge rates between different scenarios in the sand and gravel soil types. The 2016 maps (c, f and i) show similar spatial recharge patterns for Scenario 1 and Scenario 3 and lower recharge for Scenario 2, reflecting the lower precipitation in Scenario 2.
Analysis of the frequency of cell-by-cell differences between scenarios showed that despite the similar average recharge in the local and national rainfall scenarios in 2016 (Table 1), this was the result of a balancing of increases and decreases in recharge across the entire watershed. Comparisons involving the local rainfall scenario produced a broader distribution of cell-by-cell differences in recharge, while the differences between the regional and national scenarios resulted in a more general shift that affected more cells similarly.
Figure 2 shows that the cumulative streamflow results for the scenario employing local rainfall data were closer to the observed streamflow in all three years at the Water Survey of Canada (WSC) gauge.
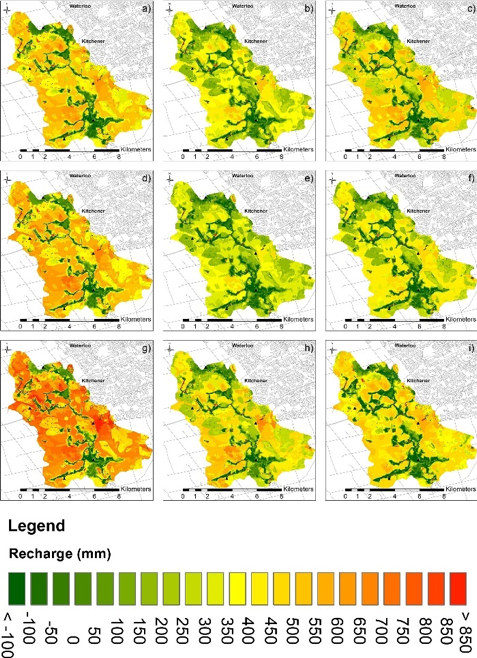
Figure 1: Recharge estimates for the three rainfall scenarios. Maps show results as follows: Scenario 1 (national), (a) 2014, (b) 2015 and (c) 2016. Scenario 2 (regional), (d) 2014, (e) 2015 and (f) 2016. Scenario 3 (local), (g) 2014, (h) 2015 and (i) 2016. The local weather stations are shown as black dots.
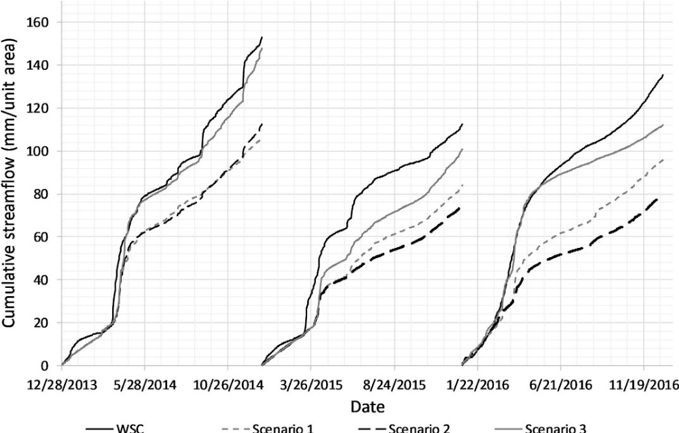
Figure 2: Comparison of cumulative streamflow results for the three simulations with recorded flows at the Water Survey of Canada (WSC) gauge.
Conclusions
This study compared the impacts of different rainfall input data on the precision of the estimated recharge distributions for the Alder Creek watershed in southern Ontario. Simulation of the three rainfall networks resulted in differences in average recharge of up to 141 mm, or around 40 per cent of previously estimated steady state recharge, indicating that annual recharge distributions estimated through numerical modelling can be quite sensitive to the spatial variability of rainfall data.
Watershed studies at shorter time-scales in certain regions are likely to benefit from more spatially precise rainfall data. The scale of available data could bias hydraulic conductivity values as calibration compensates for rainfall precision, thus misrepresenting recharge and discharge in the near-surface environment. This has potential implications for the delineation of wellhead protection areas (capture zones), the estimation of groundwater contribution areas for stream reaches, the quantification of the groundwater volume available for long-term extraction, and the assessment of contaminant loadings and transport.
Increasing the density of rain gauges could be a cost-effective way to reduce uncertainty associated with recharge estimates, when compared with the cost of collection of subsurface information at the point scale, such as drilling more wells. Future work should address the impact of radar rainfall data and snowfall distributions on recharge estimates at the watershed scale.
Wiebe, A.J. & Rudolph, D.L. (2020). On the sensitivity of modelled groundwater recharge estimates to rain gauge network scale. Journal of Hydrology, 585, 124741. doi: 10.1016/j.jhydrol.2020.124741
For more information about WaterResearch, contact Allie Dusome.


