


 Contact
 Nandita Basu Departments of Earth and Environmental Sciences and Civil and Environmental Engineering
 Frederick Cheng Department of Civil and Environmental Engineering
Introduction
Growing populations and agricultural intensification have led to increased nitrogen (N) loads in rivers, widespread oxygen depletion in coastal zones (coastal hypoxia) and increases in the incidence of harmful algal blooms. Hypoxic zones limit biodiversity, degrade ecosystem function and negatively impact coastal economies. In a warming climate, it is expected that hypoxic zones will grow larger and persist for longer periods, making it of even greater importance to decrease the export of excess nutrients from intensively managed landscapes to coastal waters.
In the United States (US), the policy response to problems of coastal hypoxia has focused on a range of interventions to reduce nitrogen loads, including the use of wetlands. Wetland restoration efforts, however, have often been carried out in an ad hoc manner, focused simply on achieving “no net loss” of wetland area. Although individual wetlands have the potential to improve water quality, little is known about the current magnitude of wetland N removal at the landscape scale. This study used a recently developed dataset of landscape N surplus values to estimate spatially varying N inputs to the more than 30 million individual wetlands across the US. The study aimed to quantify i) the magnitude of N being removed by current wetlands, ii) how a loss of these wetlands would impact water quality, iii) how might spatially targeted wetland restoration efforts maximize N removal and the achievement of water quality goals, and iv) what would be the costs associated with such restoration?
Methodology
The study used the US National Wetlands Inventory (NWI) to identify the locations and sizes of individual wetlands. Size-dependent N removal rates and residence times were estimated for each wetland as a function of surface area. Five-kilometer grid-scale N surplus values were then used to estimate N mass inputs to individual wetlands as a function of surplus N, catchment area and the fraction of N surplus that entered the wetland. Wetland N removal was estimated as the product of the incoming N load and the per cent removal, while watershed-scale N removal was estimated as a summation of N removal from individual wetlands within the watershed. A modelling approach was then used to simulate spatially explicit scenarios of wetland restoration and to estimate the potential for enhanced wetland N removal
Three scenarios were simulated: random placement (SC1); no loss of agricultural land (SC2), and targeted restoration in areas with the highest N surplus values (SC3) (Figure 1).
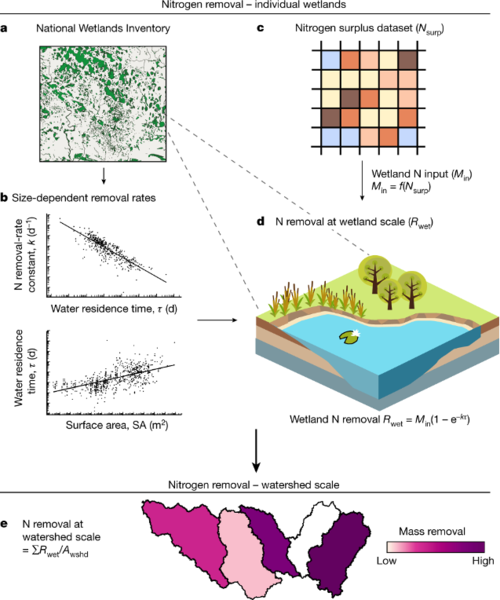
Figure 1: Approach to estimating wetland N removal
Outcomes
Study results suggest that wetlands across the US are currently removing anthropogenic N at a rate of approximately 860 ± 160 kt N yr−1, a total that represents approximately 8 per cent of the current landscape N surplus. Notably, results suggest that US-scale wetland N removal masses are an order of magnitude lower than the previously estimated, demonstrating the importance of spatially explicit N surplus values in making these estimates.
Classification of US watersheds based on wetland densities and N surplus magnitudes demonstrates a clear disconnect between nutrient source zones and potential N removal sites (Figure 2a). The majority of watersheds (41 per cent) can be considered “low-input” systems, with both a low N surplus and low wetland densities. Another 8 per cent of watersheds are also low-input, but have more wetlands and a higher N removal potential. Importantly, the study found that 38 per cent of watersheds with N surplus magnitudes in the upper quartile actually fell in the lowest quartile for wetland density. These “wetland-limited” watersheds cover nearly 40 per cent of the contiguous US, while their N surplus constitutes approximately 70 per cent of the N surplus (Figure 2b).
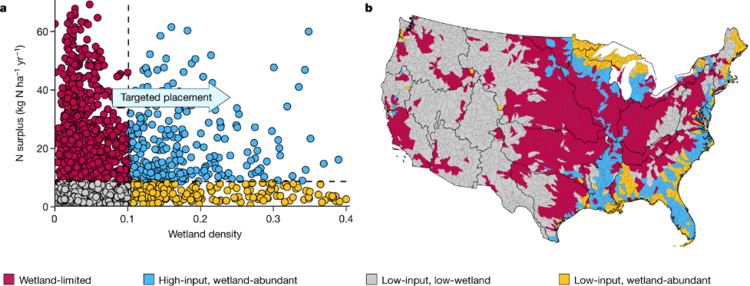
Figure 2: Spatial relationships between N source areas and existing wetlands.
a, Each point represents a watershed classified according to relative magnitudes of N surplus and wetland density (see key). The horizontal dashed line corresponds to the mean watershed N surplus magnitude and the vertical dashed line to a watershed wetland density of 10 per cent. b, Spatial distribution of the four watershed types.
The large wetland-limited area suggests that wetland restoration in high-N surplus areas has a strong potential to maximize water quality benefits. Modelling results indicate that N removal increases linearly up to an approximately 15 per cent increase in wetland area, with the highest removal levels associated with the targeted restoration scenario (Figure 3a). Costs for the three scenarios also increase in a near-linear fashion with the higher costs of targeted restoration being driven by higher land-rental costs for prime agricultural land. Although the costs for targeted restoration are nearly double those required for restoration on non-agricultural land, the targeted approach provides approximately 40 times more wetland N removal (Figure 3b).
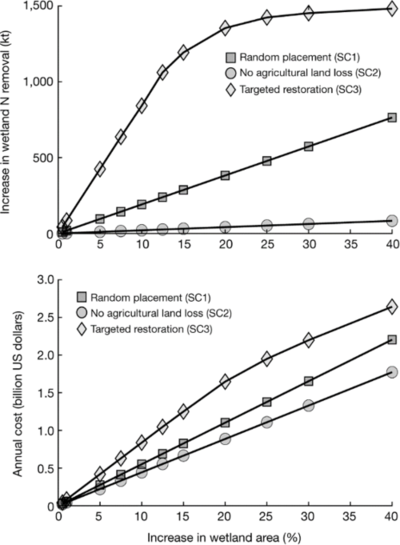
Figure 3: Estimated N mass removal and costs for the three wetland restoration scenarios
Modelling simulations using a 10 per cent increase in wetland area resulted not only in different N removal magnitudes, but also in very different spatial distributions for the restored wetlands. Under the random placement scenario, an almost uniform distribution of new wetlands across the contiguous US was generated. By contrast, targeted restoration generated higher densities of restored wetlands in areas with the highest levels of agricultural production resulting in a more than 90 per cent increase in N removal above current levels (Figure 4).

Figure 4: Wetland restoration simulation results for a 10 per cent increase in wetland area
Conclusions
The study demonstrated that current N removal by US wetlands is limited by a spatial disconnect between high-density wetland areas and N hotspots, with simulations suggesting that a spatially targeted increase in wetland area by 10 per cent would double wetland N removal. The costs of this increase in area would be approximately 3.3 billion US dollars annually, but would provide approximately 40 times more N removal than the current ad-hoc approach to restoration. Although recent work has suggested that it could take around 30 years to achieve the desired reductions in N loading owing to the presence of legacy N in soil and groundwater, wetland restoration could present a fast-track solution, enabling the capture and removal of both current-year and legacy N before it reaches downstream waters.
There are many practical and policy-related challenges to carrying out targeted wetland restoration. Specifically, there is a strong need for watershed-scale solutions that consider and balance potential water quality benefits along with farmer attitudes and the need for agricultural production. Watershed solutions are not “one size fits all”, as they require a detailed knowledge of past, current and future land use and N loading, along with an active dialogue between water authorities and land owners. The study results provide an important context for such dialogues and represent a step towards a more nuanced, landscape-scale understanding of the current and potential role of wetlands in improving water quality and reducing coastal eutrophication.
Cheng, F.Y., Van Meter, K.J., Byrnes, D.K. & Basu, N.B. (2020). Maximizing US nitrate removal through wetland protection and restoration. Nature 588, 625–630. https://doi.org/10.1038/s41586-020-03042-5
For more information about WaterResearch, contact Julie Grant.


