


Contact
 Liton Chakraborty, Partners for Action, Faculty of Environment
 Horatiu Rus, Department of Economics
Introduction
This study explores flood-related environmental injustices by deconstructing racial, ethnic, and socio-demographic disparities and spatial heterogeneity in the areal extent of fluvial, pluvial, and coastal flooding across Canada. Environmental justice (EJ) research shows that cultural minorities, persons of lower socioeconomic status, and deprived socio-demographic groups or communities often experience excessive exposure to physical hazards, for example noise and air pollution, hazardous toxic wastes, or industrial pollution through chemical spills. However, EJ studies in the context of flooding are few, and they typically report ambiguous relationships between the indicators of demographic and socio-economic status and exposure to flood hazards. This study is a first attempt to assess whether in Canada conventionally recognized socially vulnerable groups, including visible minorities (Black, Asian, Indigenous peoples), females, elderly, and lone-parent households bear a disproportionate burden of fluvial, pluvial and coastal flood risk.
Methodology
The study utilizes national datasets of flood hazards, residential address points, census of population, and census tract (CT)-level cartographic boundaries to determine flood vulnerable neighbourhoods and the number of residential properties exposed to fluvial, pluvial, and coastal flooding across 4,458 CTs in Canada. The variables influencing empirical relationships between flood risk, racial, ethnic, demographic, and socioeconomic status of households are grouped from the CT-level population characteristics to represent social vulnerability, socioeconomic and race/ethnicity status associated with a 100-year flood hazard exposure.
The dependent variable in this research is 100-year undefended, fluvial, pluvial and coastal flood-prone land areas at 30-m resolution, based on the international flood modelling firm JBA Risk Management’s 2018 flood hazard datasets. These flood maps are national in scope, enabling flood hazard assessments at any location in Canada. The independent variables include race/ethnicity, two neighbourhood socioeconomic deprivation indices to capture social vulnerability, including economic insecurity and instability indices, and four variables on socio-demographic status, representing gender, old age, and physical disability. The racial or ethnic variables, including percentages Indigenous peoples, Black, South Asians, and other visible minorities were chosen to test the conventional EJ hypotheses that racial, ethnic or cultural minority groups are inequitably exposed to flood hazards and/or disproportionately affected by flood hazards.
To deal with spatial-non-stationarity, geographically weighted regression (GWR) on continuous outcome variables like the per cent share of residential properties in a CT-exposed to flood hazards, and geographically weighted regression logistic regression (GWLR) on dichotomous outcome variables like a CT in or out of flood hazard zone.
Outcomes
The statistical analyses suggest that the overall best-fitting model for all three types of flood exposure is local GWLR. To visualize the spatial distribution of local parameter estimates, some of the regression estimates are mapped using Geographical Information Systems (GIS) across selected urban areas in Canada’s three biggest census metropolitan areas (CMA): Toronto, Montreal and Vancouver, where more than one third (36%) of all Canadians live. These maps show how the statistical associations between flood risk exposure and residents’ racial, ethnic, and socio-demographic status vary spatially by CTs.
Figure 1 portrays the relationships between pluvial flood risk and racial or ethnic and other socio-demographic variables at CT level in Toronto CMA. The positive association between a variable and pluvial flood exposure is displayed by the dark and green-shaded areas for the respective variable. A few CTs in western Toronto show, for example in Figure 1G a significant positive relationship between neighbourhood instability and pluvial flood exposure. In contrast, a few CTs in eastern Toronto show significant positive relationships in Figure 1H between economic insecurity and pluvial flood exposure. Estimated GWR parameters as displayed in Figure 1 clearly exhibit spatial-non-stationarity of covariates that explain a variety of relationships between socio-economic status and flood risk.
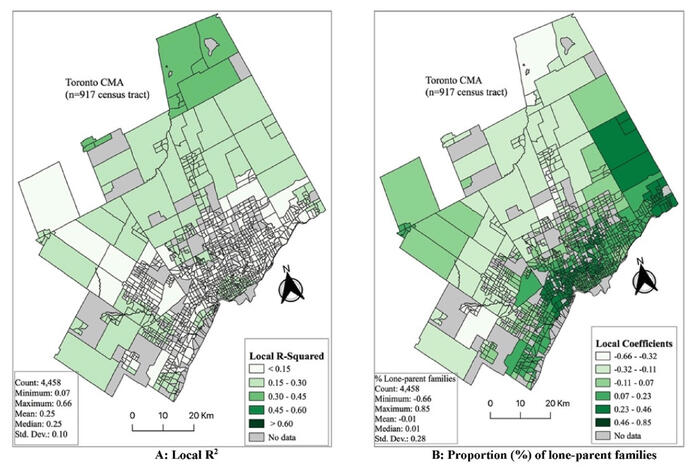
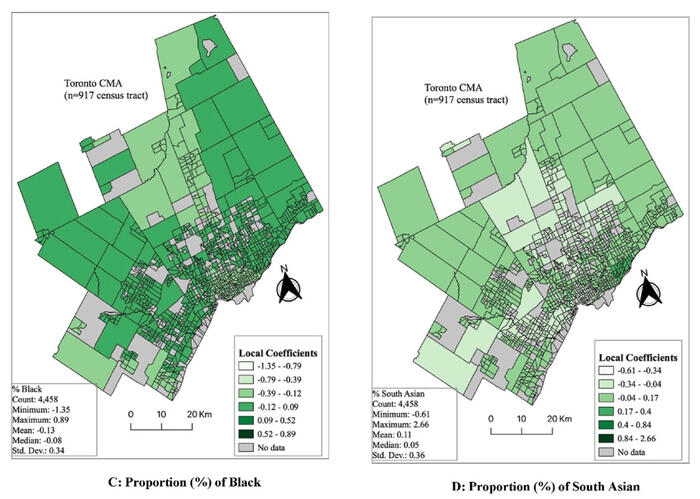
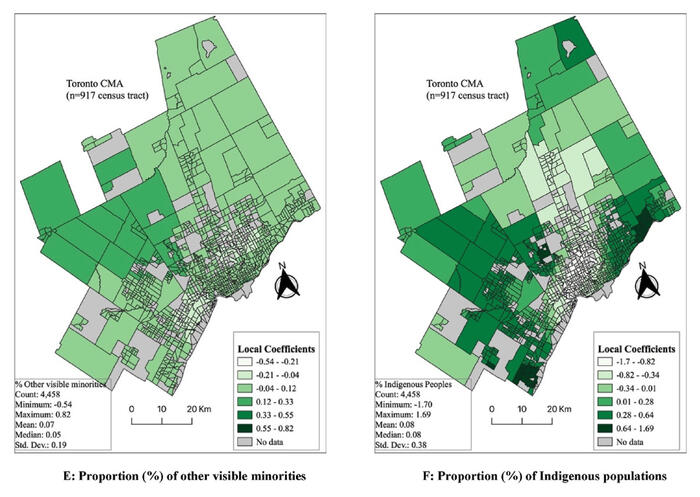
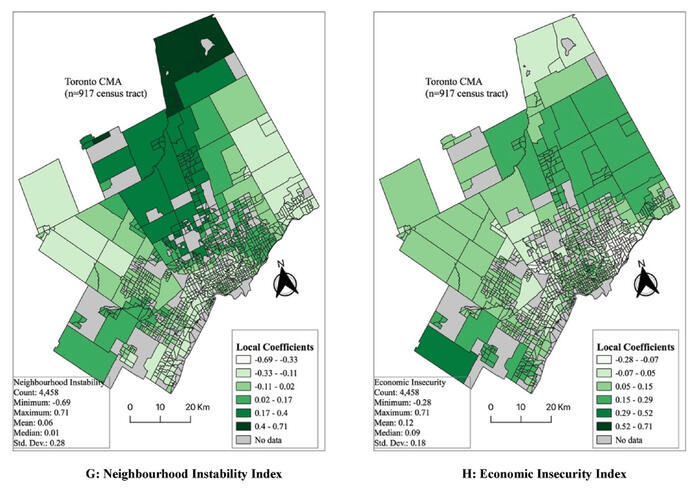
Figure 1: Spatial distribution of local GWR parameter estimates of pluvial flood risk model in Toronto CMA
Conclusions
This study is the first attempt to explore the factors associated with the socio-geographic distribution of flood risk using GWR in Canada. The GWR technique improves the OLS approach by identifying local differences in socio-economic inequalities and flood risk determinants, which help policymakers identify the spatially varying association between flood exposure and racial or ethnic and socioeconomic characteristics. The generated GWR estimates, and their geospatial maps are an important starting point for a more detailed investigation of the disproportionate impacts of flood risk at Canada’s local level.
Geospatial mapping of GWR results is a powerful tool for motivating initiatives to target population subgroups for effective flood risk communication as it provides a scientific basis for the location-specific allocation of public resources to reduce socio-economic inequalities. The study finds that racial or ethnic, economic, social, and demographic factors play a significant explanatory role in the distribution of flood risk across Canadian neighbourhoods, even after controlling for spatial effects. Specifically, exposure to flood risk is more significant in Canadian neighbourhoods that predominantly comprise certain vulnerable groups such as females, persons living alone, Indigenous, South Asians, the elderly (age 65 and over), other visible minorities, and economically insecure residents. These findings can help promote a socially just flood risk management approach emphasizing the need to acknowledge socio-economic heterogeneity within various racial, ethnic, and socio-demographic groups.
Chakraborty, L. Rus, H., Henstra, D., Thistlethwaite, J., Minano, A. and Scott, D. (2022). Exploring spatial heterogeneity and environmental injustices in exposure to flood hazards using geographically weighted regression. Environmental Research. https://doi.org/10.1016/j.envres.2022.112982
For more information about WaterResearch, contact Julie Grant.
Photo: Don Valley Parkway under water by Roozbeh Rokni CC BY-NC-ND 2.0


