


Contact

Roy Brouwer
Department of Economics

Merrin Macrae
Department of Geography and Environmental Management

Introduction
Lake Erie is the most vulnerable Great Lake to eutrophication where excess nutrient loadings cause harmful algal blooms. In order to address eutrophication impacts, the Canada-US Great Lakes Water Quality Agreement includes a commitment to reduce total phosphorus (TP) loads into Lake Erie’s central and western basins by 40% from 2008 levels. Best Management Practices (BMPs) have been used to reduce nutrient runoff from agriculture-dominated watersheds. While BMPs are typically evaluated based on their effectiveness in reducing nutrient loads, evaluations that also include implementation costs help to identify least cost approaches to achieve environmental targets.
The objective of this study was to identify the optimal spatial distribution of BMPs to reduce TP runoff from agricultural land in the largest Canadian watershed draining into Lake Erie. The Grand River watershed (GRW) in southern Ontario covers an area of approximately 6,800 km2 and flows for around 300 km from its source to Lake Erie. The watershed is more than 70% agricultural and in 1998 a voluntary cost-sharing program called the Rural Water Quality Program (RWQP) was launched to provide financial assistance to farmers to adopt water quality BMPs (Figure 1). The study was transdisciplinary, where economists worked hand-in-hand with agricultural and environmental scientists and the Grand River Conservation Authority who provided a unique BMP database from the RWQP.
Methodology
The study accounts for upstream–downstream relationships between the 90 sub-basins identified in the GRW and includes both public BMP program implementation costs (PIC) and farmers’ private pollution abatement costs (PAC) in identifying which combination of BMPs constitutes the least cost approach to additional TP reductions. Comparing the two provides important insight into how much existing BMP cost-sharing programs incentivize farmer participation.

Figure 1: Grand River watershed location and land use.
The study applied an integrated hydro-economic modeling framework to perform a spatially explicit cost-effectiveness analysis (Figure 2). Information from the RWQP was used to build a database of 640 BMP projects across 90 sub-basins used to estimate baseline TP loads, BMP effectiveness and BMP costs. Four BMP types – fertilizer application reduction, cover crops, buffer strips and wetland restoration – were assessed under various scenarios (Table 1). Water quality impacts were predicted through the simulation of BMPs in SWAT. BMP costs were estimated to represent financial transactions between the public agency (RWQP) and farmers on the one hand and farmers’ opportunity costs such as land retirement or changing productivity, on the other hand. A quadratic cost function was fitted to reflect that an initial small decrease in TP could be obtained at a relatively small cost and that larger TP reductions would trigger increasing marginal costs.

Figure 2: Integrated hydro-economic modeling framework
Table 1: Best Management Practice scenarios
|
BMP |
Definition |
SWAT integration |
|---|---|---|
|
Fertilizer reduction |
Fertilizer application reduction on crop fields to promote more effective use of available nutrient resources |
|
|
Cover crops |
Temporary winter cover crop grown in rotation with regular crops to avoid and control soil erosion |
|
|
Buffer strips |
Vegetation (grasses, wildflowers, shrubs, trees) planted along water courses |
|
|
Wetland restoration |
Conversion of agricultural lands to wetlands |
|
Outcomes
Modeling results estimated that the Grand River discharged an average of 386.5 tons of TP annually into Lake Erie between 1989 and 2017, with sub-basins with intensive agricultural activities (so-called critical source areas) contributing by far the greatest loads (Figure 3). Table 2 summarizes the impact of BMPs on reducing baseline TP runoff into Lake Erie and shows that i) the efficacy of BMPs is highly dependent on the location and size of the sub-basin where it is implemented and ii) implementing individual BMPs will not achieve the 40% TP reduction target, meaning that combinations of BMP will likely be required.
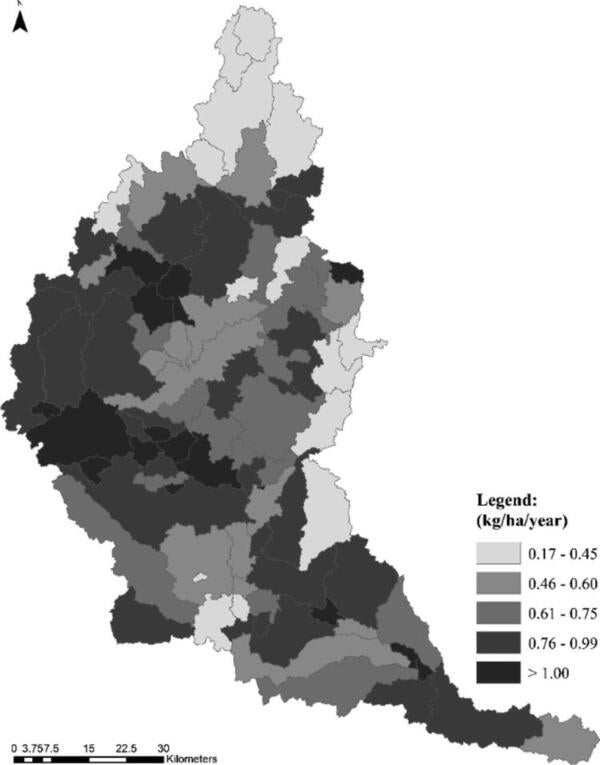
Figure 3: Spatial distribution of average total phosphorus baseline loads.
Table 2: TP load reductions and average BMP program implementation and abatement costs (2020 prices).
|
Best management practice |
TP load reduction (t/year) |
Ranking |
Average BMP PIC ($/kg) |
Ranking |
Average farmer PAC ($/kg) |
Ranking |
|---|---|---|---|---|---|---|
|
Nutrient management plan |
2.8 |
1 |
||||
|
- 10% fertilizer reduction |
16.6 |
12 |
1,135.1 |
5 |
||
|
- 20% fertilizer reduction |
32.9 |
8 |
1,440.2 |
8 |
||
|
- 30% fertilizer reduction |
45.6 |
5 |
1,736.6 |
9 |
||
|
- 40% fertilizer reduction |
58.0 |
3 |
2,128.6 |
10 |
||
|
- 50% fertilizer reduction |
69.9 |
1 |
2,781.5 |
12 |
||
|
Cover crops |
51.0 |
4 |
546.1 |
2 |
6.7 |
1 |
|
Buffer strips |
2124.3 |
4 |
||||
|
- 3 m width |
20.6 |
11 |
380.0 |
2 |
||
|
- 5 m width |
23.9 |
10 |
642.6 |
3 |
||
|
- 10 m width |
29.3 |
9 |
1,174.7 |
7 |
||
|
- 30 m width |
40.4 |
6 |
2,558.6 |
11 |
||
|
Wetland restoration |
1194.1 |
3 |
||||
|
- 2% of all cropland |
34.8 |
7 |
663.4 |
4 |
||
|
- 4% of all cropland |
59.0 |
2 |
1,164.8 |
6 |
The variation in BMP implementation costs across sub-basins was large, however nutrient management plans were found to be the most cost-effective BMP from a PIC perspective. The ranking of BMPs changed when considering farmer costs or PAC, where cover crops were the preferred BMP (Table 2).
The optimization showed that PAC are initially lower than PIC; intersecting at a 30% TP reduction after which the PAC exceed PIC. The increase in costs when going from a 10% to a 50% TP reduction showed diminishing returns. Should a 40% reduction be imposed on the discharge of TP from the Grand River into the eastern basin of Lake Erie, the estimated total economic costs based on the crop-related BMPs in the study amount to almost $52 million per year (Figure 4).

Figure 4: Estimated cost functions to reduce TP loads from the Grand River watershed into Lake Erie.
The optimal spatial composition of BMPs varied depending on the imposed TP restriction and cost type (PIC or PAC). Figure 5 shows the difference between selected BMP programs for a 40% TP reduction and shows that wetland restoration dominates BMPs when optimizing for PIC, whereas cover crops prevail when optimizing for PAC.

Figure 5: Composition of the optimal combination of BMPs to reduce TP discharge to Lake Erie by 40% based on program implementation costs (top) and farmer pollution abatement costs (bottom).
Note: Numbers on the horizontal axis refer to the 90 sub-basins in the Grand River watershed. Upstream starts on the left-hand side with number 1 (near Dundalk) and the outlet downstream is number 90 (near Dunnville).
Conclusions
This study presents a comprehensive watershed scale economic assessment of a BMP cost-sharing program to reduce nutrient loads to Lake Erie. Specifically, 20 years of BMP implementation data was used to perform a spatial optimization procedure to identify the most environmental and cost-effective program of BMPs, considering both public programming costs and farm-level private costs, to inform the incentive-compatibility of future TP reduction policies and programs.
The variation in both BMP effectiveness and cost across the Grand River watershed emphasized the need for spatial optimization, identifying not only which BMPs are most cost-effective in reducing TP loads entering Lake Erie, but also where in the watershed these BMPs should be implemented. Although there was some overlap between the optimal spatial allocation of BMPs and where BMPs have been implemented previously, the study demonstrated that optimization yields a different prioritization of future BMPs across the watershed. This is due to the fact that SWAT enabled the consideration of TP contributions at the sub-basin level and that the study accounted for the economic costs faced by farmers for BMP implementation instead of just the public program implementation costs. The study approach and results provide important guidance to policy makers and practitioners when considering watershed-scale nutrient reduction targets and the spatial allocation of BMPs across agricultural watersheds to improve water quality.
Read more in Canadian Journal of Agricultural Economics
Brouwer, R., Pinto, R., Garcia-Hernandez, J., Li, X., Macrae, M., Rajsic, P., Yang,W., Liu, Y., Anderson, M., & Heyming, L. Spatial optimization of nutrient reduction measures on agricultural land to improve water quality: A coupled modeling approach. Canadian Journal of Agricultural Economics/Revue canadienne d’agroeconomie, December, 2023. https://doi.org/10.1111/cjag.12342
For more information about WaterResearch, contact Julie Grant.


