


Contact

Nandita Basu
Departments of Earth and Environmental Sciences and Civil and Environmental Engineering

Nitin Singh
Department of Earth and Environmental Sciences

Introduction
The last decade has seen an increase in the frequency and intensity of algal blooms in the transboundary Laurentian Great Lakes Basin (GLB) impacting fisheries, drinking water supplies and recreational and economic activities. Algal blooms result from eutrophication where excess nutrients from urban and agricultural activities are discharged to downstream waters. The Great Lakes Water Quality Agreement commits Canada and the United States to reduce total phosphorus inputs to targeted GLB subbasins by 40 per cent.
A comprehensive analysis of phosphorus species across the GLB is lacking with previous research largely focused on phosphorus loads to Lake Erie. This study analyzes decadal trends in annual and seasonal concentrations of total phosphorus (TP) and soluble reactive phosphorus (SRP) across the GLB to determine if TP and SRP concentrations vary across the basin, how concentrations have changed over time and what watershed characteristics are associated with changes.
Methodology
The study analyzed water quality data from over 370 watersheds across the GLB. Watersheds had a wide range of sizes and variability in land use, including 239 agricultural, 83 forest/wetland, 27 urban and 50 mixed-use watersheds. To understand the current state, five-year mean concentrations were quantified from 2015 to 2019. To understand trends, annual and seasonal mean concentrations were calculated from 2003 to 2019. SRP:TP daily ratios were used to estimate annual and seasonal mean ratios. Time series data were used to test for the presence of monotonic time trends using the Mann–Kendall trend test.
A combination of linear regression and random forest modelling was used to explore how various landscape and climate factors impacted SRP and TP trends. Random Forest (RF) modeling is a non-parametric, machine learning-based multivariate regression approach that uses a decision tree framework to simulate dependent variables.
Outcomes

Figure 1: Phosphorus concentrations in streams across the Great Lakes Basin.
a,c, Mean annual TP (a) and SRP (b) concentrations from 2015–2019 b,d, Violin plots showing the distributions of TP (b) and SRP (d) observations across the major subbasins with the number of streams in each subbasin denoted by n. White-filled circles show the median value, thick lines the interquartile range and whiskers extend to a maximum of 1.5 times the interquartile range. The dashed lines indicate the eutrophic threshold.
Temporal analysis identified a dominant pattern of increasing SRP and decreasing TP concentrations. Seasonal analysis showed significantly increasing SRP trends in winter, spring, summer and fall, while TP did not show a significant trend across seasons. The median increase in SRP concentrations was 70 per cent per decade with similar patterns at the seasonal scale.
The relationship between SRP and TP trends was used to identify and map four response typologies: increasing SRP and TP, increasing SRP and decreasing TP, decreasing SRP and TP and decreasing SRP and increasing TP. Increasing SRP and TP watersheds were found across land-use types, including in urban, agricultural and forested/wetland watersheds, while increasing SRP and decreasing TP watersheds were found in urban and agricultural watersheds. A greater proportion of watersheds with increasing SRP and decreasing TP were located in the more northern basins. These results demonstrated increasing SRP trends across the basin regardless of land use (Figure 2). In addition, 67 per cent of the watersheds demonstrated a significant increase in the annual and seasonal SRP:TP ratio with watersheds at higher latitudes showing a greater increase (Figure 3).
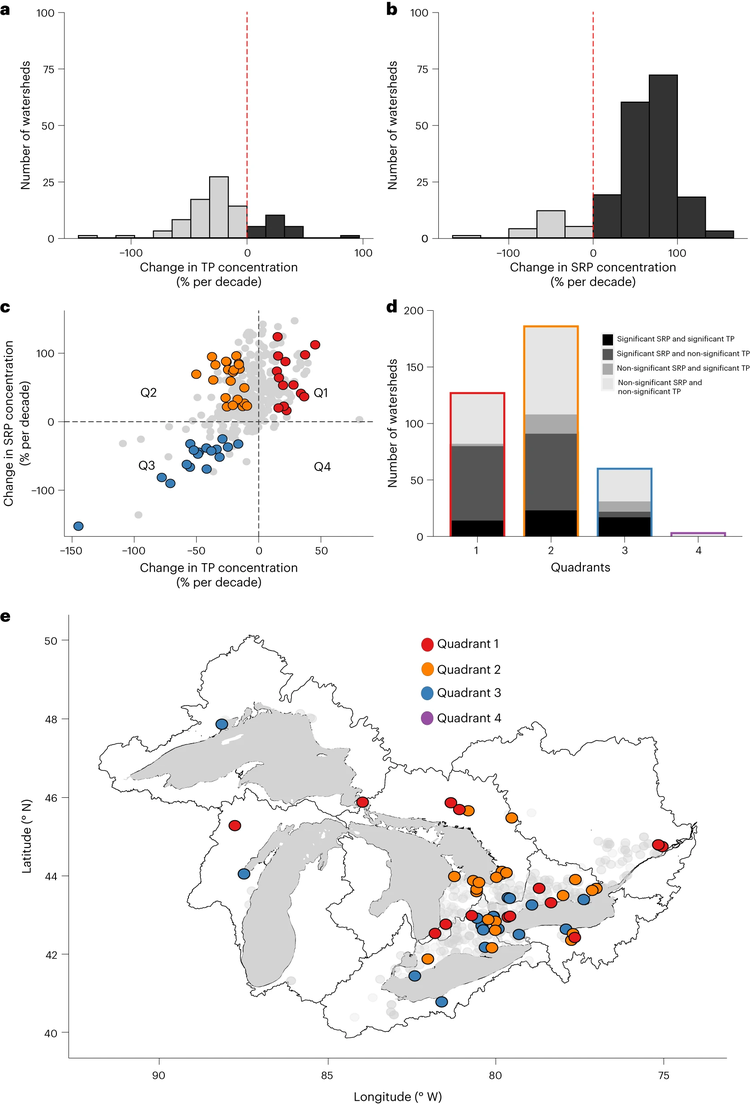
Figure. 2: Temporal trends in SRP and TP concentrations across the Great Lakes Basin.
a,b, Histogram of percent change in SRP (a) and TP (b) concentrations from 2003 to 2019 c, Quadrant plot showing the relationship between SRP and TP trends and identifying four typologies of response: Quadrant 1 (increasing SRP and TP), Quadrant 2 (increasing SRP and decreasing TP), Quadrant 3 (decreasing SRP and TP) and Quadrant 4 (decreasing SRP and increasing TP). Coloured filled circles represent significant trends; grey filled circles represent non-significant trends. d, Number of watersheds in each of the four quadrants. e, Spatial distribution of the typologies across the Great Lakes Basin. Coloured circles represent significant trends; grey circles represent non-significant trends.
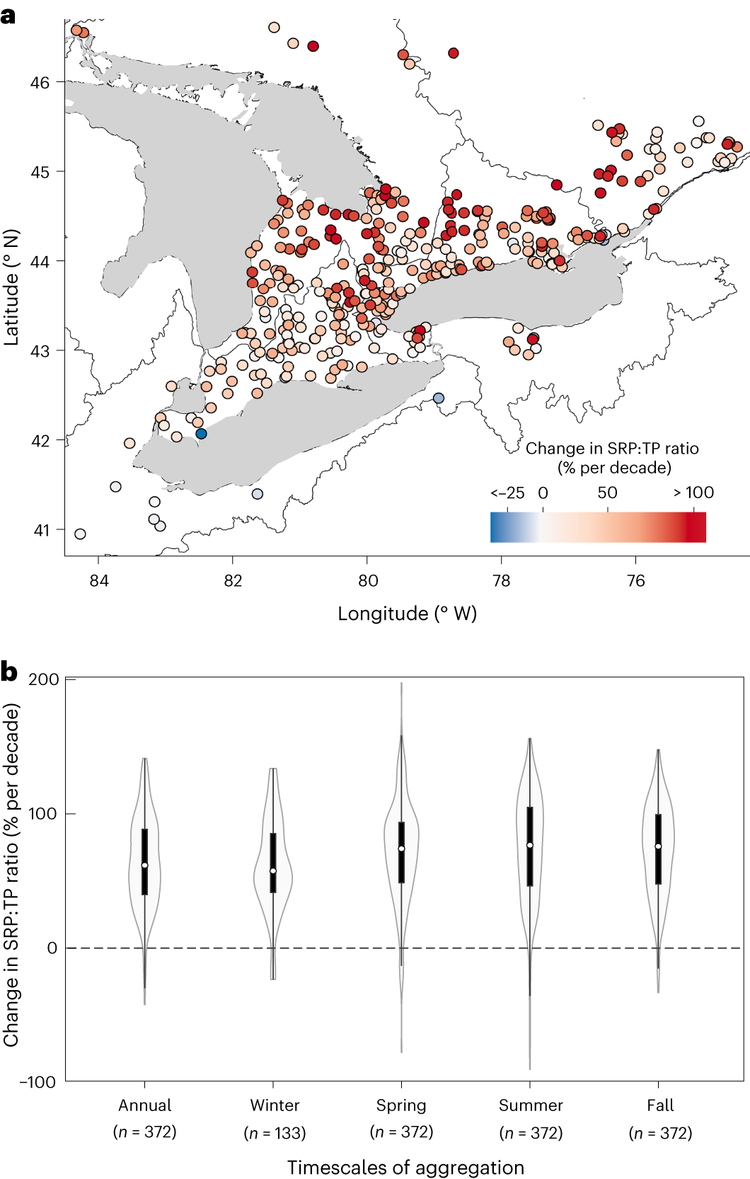
Figure 3: SRP:TP ratios across the Great Lakes Basin.
a, Percent change in annual SRP:TP ratios b, Percent change in annual and seasonal SRP:TP ratios. Violin plots show the distributions of observations for SRP:TP ratios across the basin, with the number of streams within each season and annually denoted by n. Within the violins, white-filled circles show the median value, thick lines the interquartile range and whiskers extend to a maximum of 1.5 times the interquartile range.
Correlation analysis and RF modelling found the highest relative SRP concentrations at high latitude watersheds attributable to both climate and land-use drivers. The positive relationship between SRP and latitude persisted with the seasonal RF models, with the strongest relationship during winter. There was also a significant correlation between the temporal trends in maximum temperatures and SRP concentrations, with the strongest relationships in winter and spring likely due to the greater frequency of freeze–thaw events (Figure 4).
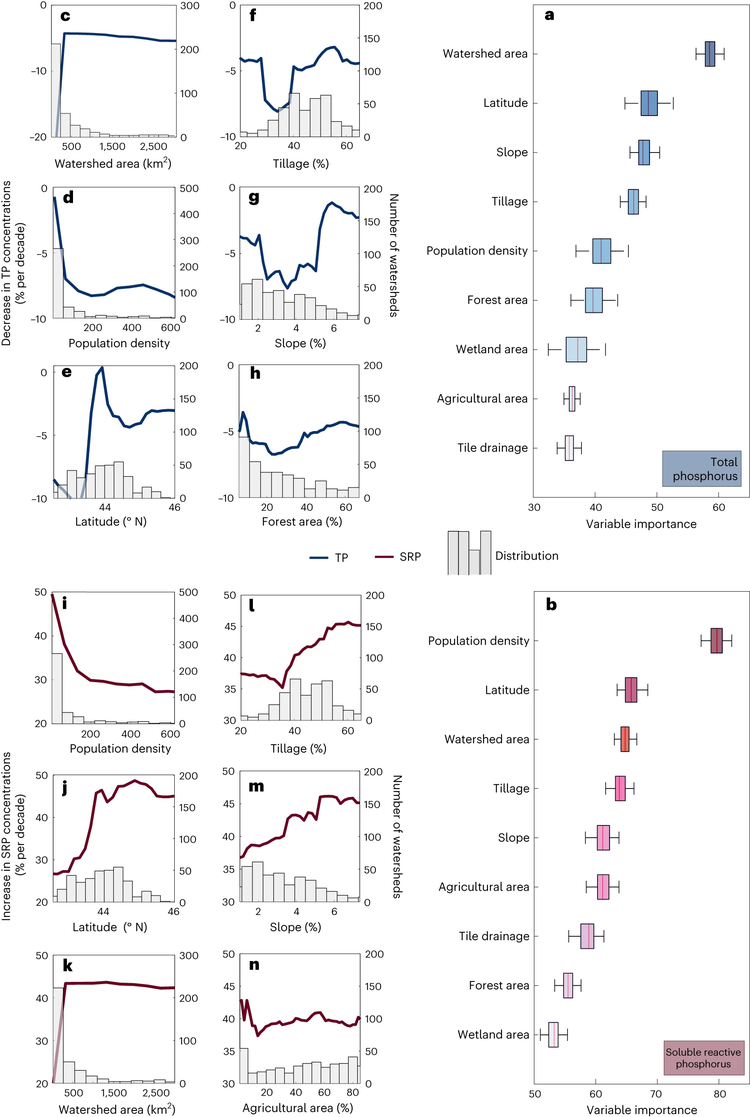
Figure 4: RF models describing trends in TP and SRP concentrations as a function of watershed attributes.
a,b, The ranked importance of key predictors for TP (a) and SRP (b) across model runs is represented by box and whisker plots, which show the median values (vertical line in each box), the interquartile range (width of the box) and the whiskers that extend to a maximum of 1.5 times the interquartile range. Predictor boxes are shown across a colour gradient with darker colours indicating a higher level of importance. Adjacent boxes of the same colour indicate that there is no significant difference in importance between those predictors. c–n, The partial dependence plots for change in TP (c–h) and SRP (i–n) concentrations show the marginal relationships between the predictor variables (x axis) and the percent change in concentrations (y axis). The histograms of the predictor variables are presented in grey to highlight the effect of data density on the relationships.
Conclusions
Analysis of trends in SRP and TP concentrations from 2003 to 2019 across more than 350 watersheds in the Great Lakes Basin revealed widespread increases in SRP concentrations (46 per cent of watersheds) and SRP:TP ratios (67 per cent of watersheds). TP concentrations, in contrast, increased in only 5 per cent, and decreased in 18 per cent, of watersheds. A clear latitudinal gradient emerged, with greater increases in SRP and SRP:TP ratios observed in northern watersheds characterized by steeper terrain and greater forest cover. These increases may be attributable to a complex interplay of land use, soil type and climate factors, including agricultural practices that mobilize sorbed phosphorus, increased mobilization of stored phosphorus as forests recover from acidification and warming winter temperatures that activate subsurface pathways and increase the mobilization of sorbed phosphorus.
While previous studies have reported increasing SRP concentrations in specific agricultural watersheds, this study provides evidence of a widespread increase in concentrations across diverse land uses. With warming temperatures, increasing precipitation and rising stream flows, a pervasive increase in SRP concentrations implies a corresponding rise in SRP loads which may be contributing to a higher frequency and intensity of algal blooms in the GLB. Greater increases in SRP concentrations in forested areas may also contribute to the occurrence of algal blooms in traditionally oligotrophic, pristine lakes, posing threats to drinking water sources and economies reliant on tourism. Furthermore, although percentage increases may not be as pronounced in Lake Erie’s agricultural watersheds, the already elevated SRP concentrations and SRP:TP ratios in these areas mean that even a slight relative increase can have severe implications for stream and lake water quality.
Read more in Nature Geoscience
Singh, N.K., Van Meter, K.J. & Basu, N.B. Widespread increases in soluble phosphorus concentrations in streams across the transboundary Great Lakes Basin. Nature Geoscience. September 2023 https://doi.org/10.1038/s41561-023-01257-5
For more information about WaterResearch, contact Julie Grant.
Listing Photo: Harmful Algal Bloom in Western Basin of Lake Erie by Aerial Associates Photography, Inc. Zachary Haslick via NOAA Great Lakes Environmental Research Laboratory.


