


Introduction
Food security is inextricably tied to water availability for irrigation. In arid and semiarid regions, a significant fraction of irrigation water demand is met by mining groundwater, such as in India where groundwater supplies 60 per cent of irrigation water. Given the societal dependence on this critical resource, accurate identification of groundwater depletion is imperative.
Recent analyses have identified North India as a hot spot for groundwater depletion, while water levels are reported to be rising in South India. These findings contradict on-the-ground field reports and farm surveys, and additional evidence that farmers are drilling deeper wells. If groundwater rejuvenation is indeed occurring in South India, why are farmers switching from shallow to deep wells, and why are reports of groundwater stress increasing?
This study hypothesized that the lack of agreement between large-scale analysis of groundwater vulnerability and on-the-ground reports in South India can be attributed to methodological constraints arising from the unique characteristics of hard-rock aquifers, specifically their low storage capacity and heterogeneous spatial patterns of storage. Specific objectives were to (1) assess groundwater storage trends using traditional data sources (i.e., monitoring wells, satellite data), (2) explain differences in groundwater stress inferred from traditional hydrological data versus “soft” non- hydrological data (i.e., census surveys, field reports, newspaper searches), and (3) identify alternative large-scale metrics of groundwater depletion that are consistent and reliable.
Methodology
District-wide irrigated area (1996 to 2011) and monthly precipitation (1980 to 2016) data were collected. Precipitation data were converted to standardized index values to represent region-specific dry and wet periods. Monthly GRACE data (2002 to 2016) were used to estimate the satellite-derived groundwater storage anomalies by subtracting surface water storage from the GRACE-derived terrestrial water storage anomaly.
Observation-based well data (1996 to 2016) were obtained that contained water level measurements recorded four times a year for 29,513 wells. Of these, 12,279 wells were active in 1996, representing wells with the longest possible records in the database. For shallow wells, wells with >18 years of data were used to estimate groundwater trends. For deep wells, wells with >10 years of data were used.
The statistical significance of trends in groundwater storage for both satellite and monitoring well data was assessed using the nonparametric Mann-Kendall trend test, while slopes were estimated using the Theil-Sen slope estimation method. Trends and slopes in GRACE data were estimated at the yearly time scale after averaging the monthly groundwater storage anomalies estimates. Trends in observation well data were obtained separately for each of the four months to avoid the influence of seasonality.
Outcomes
The analysis of satellite data showed significant widespread decreasing trends in groundwater storage in North India for both the 2002–2016 and 2005–2016 time periods. South India, however, showed a significant positive trend if 2002 was used as a start date, and showed non-significant trends if 2005 was used as a start date. We argue that in a monsoonal climate with high inter-annual variability in precipitation it is important to consider the starting point of analysis when evaluating the significance of various groundwater trends. In addition, while GRACE data analysis provides an excellent estimate of regional trends in groundwater depletion, it is aggregated at a larger scale and provides no information on local depletion hot spots.
The analysis of groundwater well monitoring data showed that, other than two northwestern states, the majority of wells showed no significant trends. Past studies have tended to draw conclusions based on either wells with only significant trends, or by not testing for significance. By only considering wells with significant trends, we found that both shallow and deep wells in North India show declining trends, while in South India the deep wells show a declining trend and shallow wells show an increasing trend. When the wells are not segregated by depth, the median water level trends in all wells more closely mimics that of the shallow wells, explaining why previous studies that did not segregate wells by depth found an increase in water levels in South India wells.
Our analysis of groundwater level data highlighted two critical points. First, there are significant depth variations in water level trends in a multi-aquifer system that characterizes the Indian subcontinent, and thus, aggregating information with depth conceals critical trends and stresses. Second, in shallow, hard-rock aquifer systems with low storage buffers and high interannual variability in water levels that characterize most of South India, a large fraction of the wells have non-significant trends and there is critical information that is missed by not considering them.
However, the question remains: Given that a majority of wells show a lack of any significant declining trend in South India, why do irrigation statistics, and on-the-ground observations allude to groundwater stress?
We contend that this can be explained using the concept of survivor bias. Survivor bias is an artifact that arises in the statistical analysis of data by focusing on data that were filtered based on some selection criterion. Subsequent analysis of the data that “survived” has the potential to significantly skew the results and conclusions. In the case of groundwater well data, an often-used selection criterion is where wells with a certain proportion of missing data, for example, because they go dry, are routinely eliminated from the analysis of long-term trends.
To test for potential survivor bias, we explored the relationship between the percentage of dry wells and metrics that capture climate variability and anthropogenic stress on the groundwater resources. We found a higher percentage of dry wells in years with a low standardized precipitation index, confirming that the missing data are most likely related to dry spells when water level in wells fell below the screen level (Figure 1a). To understand the relationship between the share of dry wells and the degree of groundwater development at the district scale, we estimated the median share of dry wells by aggregating the share of dry wells per year over the 20 years. We found a higher proportion of dry wells in areas with higher groundwater irrigation, clearly indicating that the missing data were not random (Figure 1b).
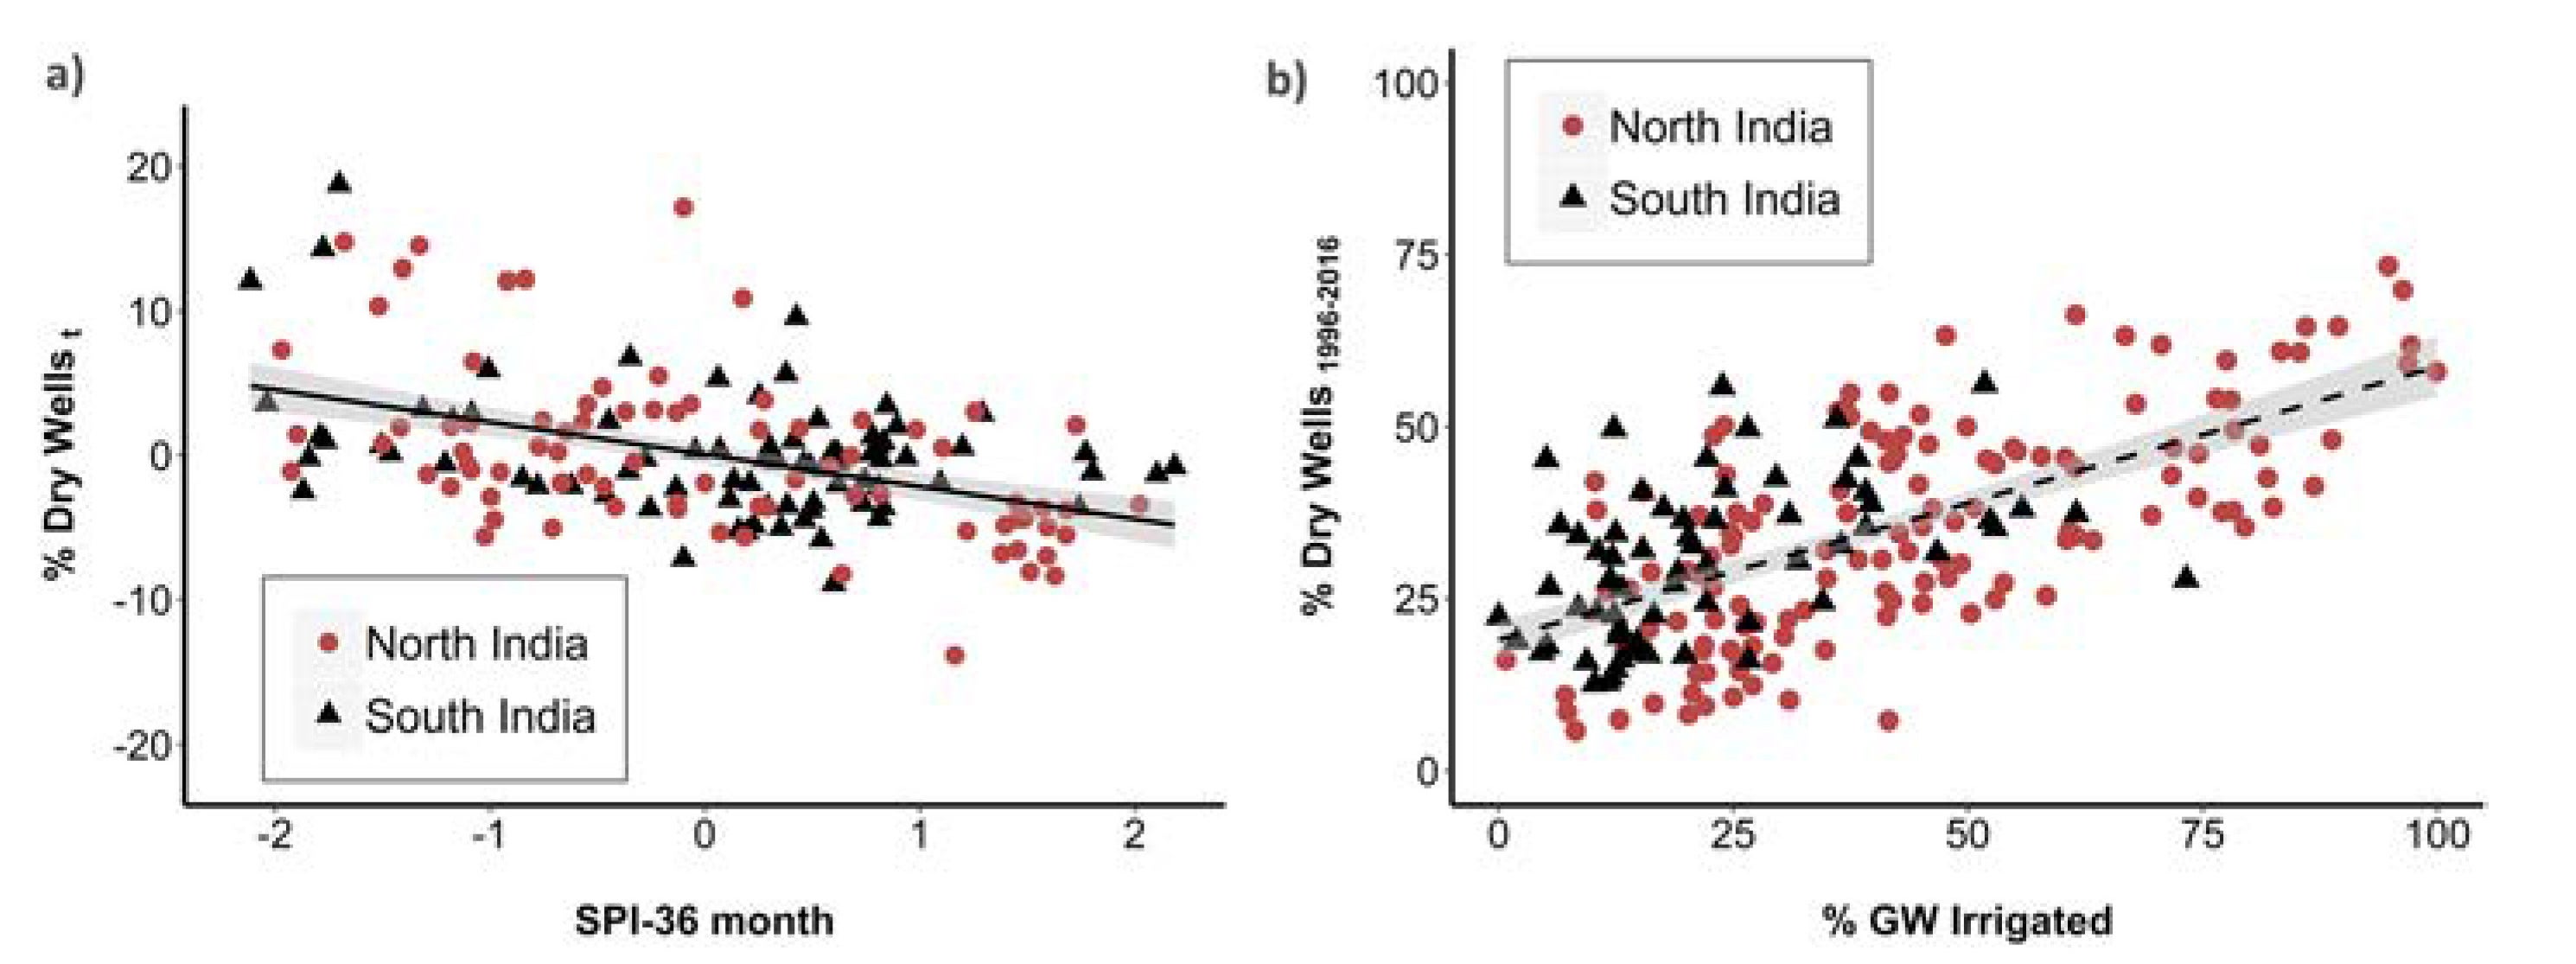
FIGURE 1: Dependence of dry well density on rainfall and groundwater irrigated area. (a) Percentage of dry monitoring wells (after removing trend) aggregated at the North and South India scale (referred to as % Dry Wellst) versus the 36 month standardized precipitation index for each month between 1996 and 2016. (b) Percentage of dry monitoring wells at the district scale, aggregated over the 1996–2016 time frame (referred to as % Dry Wells1996–2000) versus the percentage of groundwater irrigation in the district.
We propose two metrics to measure groundwater sustainability in hard-rock systems: defunct wells and dry wells. We found a steady increase in the share of defunct and dry wells in both North and South India highlighting the increased stress in groundwater. We found that nearly 93 per cent of the defunct wells had either a significant negative trend or no long-term trend, supporting the validity of these metrics as an appropriate indicator (Figure 2).
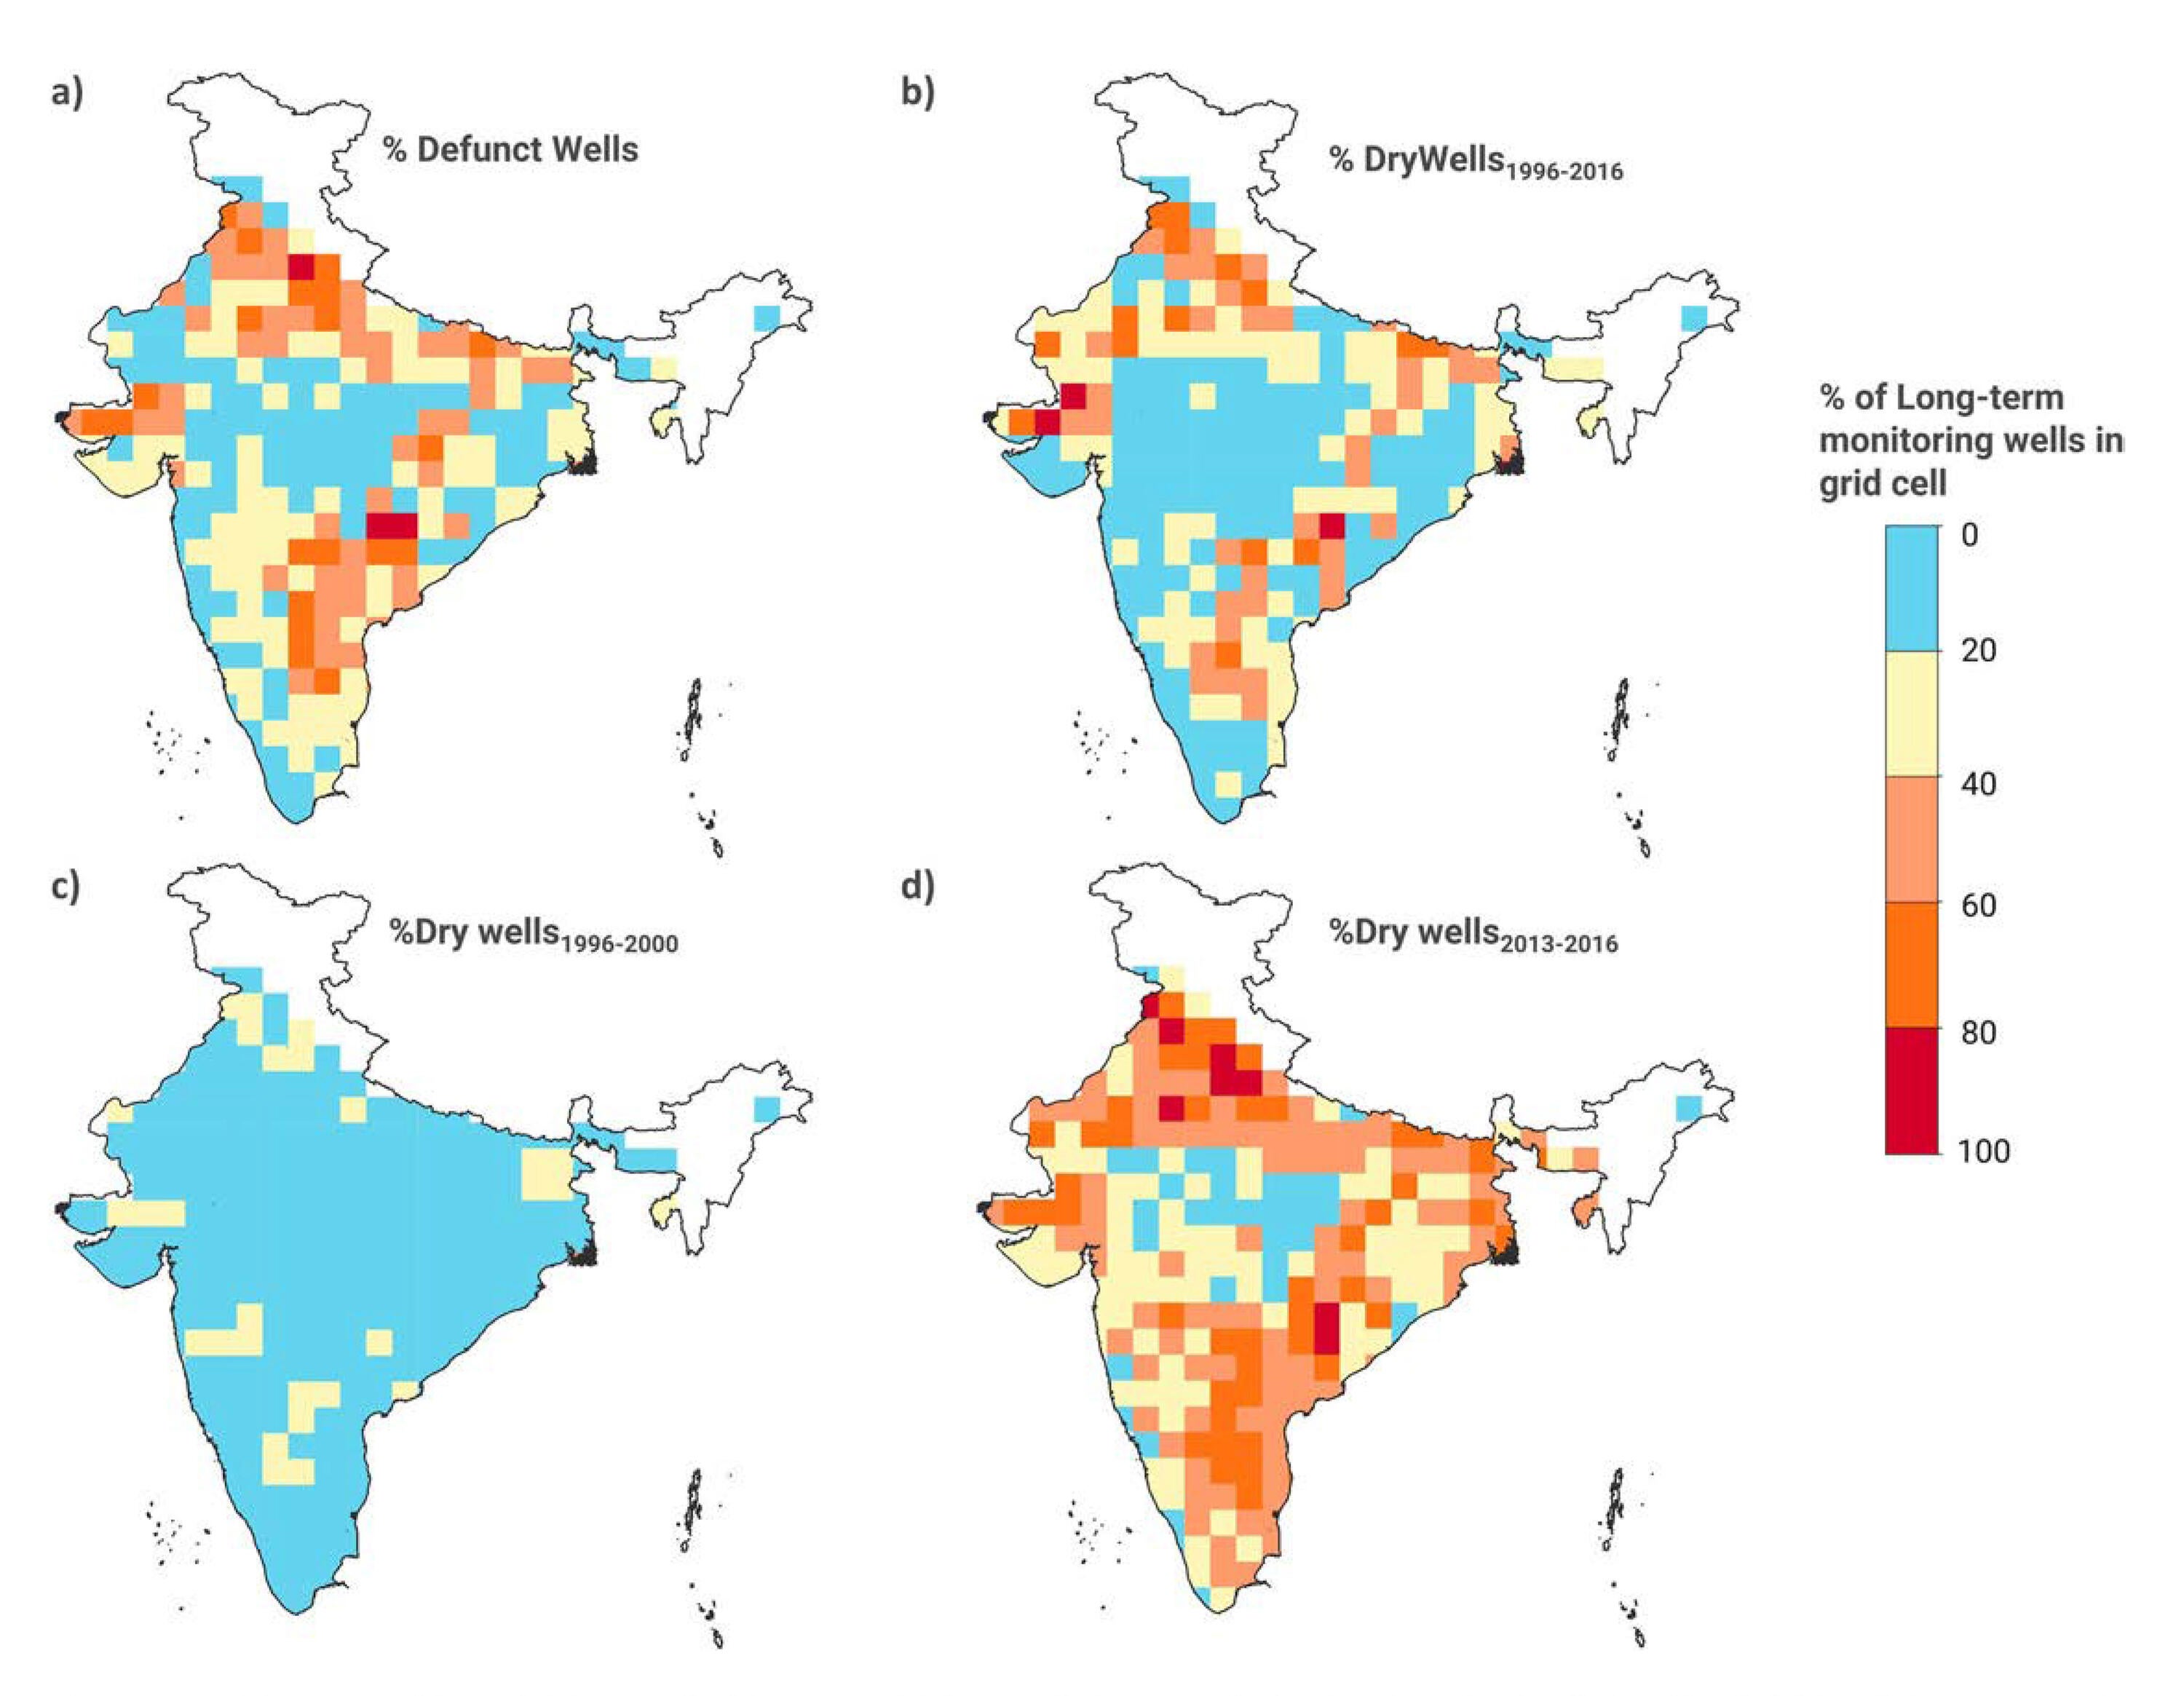
FIGURE 2: Spatial patterns of dry and defunct wells. (a) Per cent of defunct wells in 2016. (b) Median percentage of dry monitoring wells between 1996 and 2016. (c) Median percentage of dry monitoring wells between 1996 and 2000. (d) Median percentage of dry monitoring wells between 2013 and 2016. Higher percentage of dry/defunct wells (orange/red) indicates relatively more groundwater stress, and lower percentage of dry/defunct wells (yellow/blue) indicates relatively less groundwater stress.
Conclusions
The study was motivated by the need to answer the question of why farmer distress is increasing in regions experiencing apparent groundwater recovery. Analyses of both GRACE satellite and groundwater monitoring data show large areas in South India with stable or increasing water level trends, which is at odds with findings from social survey data. The study demonstrates that this discrepancy arises due to the problem of survivor bias, where wells with too much missing data are routinely excluded from long-term trend studies. We find that aquifer dryness can manifest itself in data gaps in monitoring well records. These wells carry critical information on the degree of groundwater stress in a region. Correct interpretation of monitoring well data shows that South India is indeed facing significant groundwater stress, and thus requires improved regulations to help meet local demands for groundwater in a more sustainable manner.
We argue that in hard-rock aquifer systems with large precipitation-driven interannual variability and significant spatial heterogeneity, water level trends are not an adequate metric to measure groundwater stress. We provide two metrics, percentage dry and defunct wells, derived from data gaps in monitoring wells that might be better suited for assessing groundwater stress in these regions. In South India, both the share of defunct and dry wells have been increasing over time, and the hot spots identified by them correspond well with areas that have local reports of well-failures.
Groundwater storage and its linkage to socio- environmental demands in India is a complex, interdisciplinary issue. As we improve our ability to monitor groundwater systems, the interpretation of the data collected and its linkage to on-the-ground reality remains important in developing sustainable groundwater management practices. Government agencies have tended to argue that monitoring data are the only reliable source of data and farmer surveys that rely on self-reported recall information are unreliable. By triangulating across different official data sets at the national scale, our study uncovers methodological limitations in conventional long-term trend analysis of groundwater levels. Although the study is focused on the Indian subcontinent, the findings are applicable to hard-rock aquifers that underlie substantial areas in arid and semi-arid regions around the world.
Contact
 Nandita Basu, Departments of Civil and Environmental Engineering and Earth and Environmental Sciences
 Tejasvi Hora, Department of Civil and Environmental Engineering


Hora, T., Srinivasan, V. & Basu, N.B. (2019). The groundwater recovery paradox in South India. Geophysical Research Letters, 46(16). doi.org/10.1029/2019GL083525
For more information about WaterResearch, contact Julie Grant.


