


 Contact
 David Clausi, Department of Systems Design Engineering
 Claude Duguay, Department of Geography and Environmental Management
Introduction
Changes to ice cover on lakes has been established as an indicator of climate change. A movement towards later freeze-up and earlier break-up dates on northern lakes is expected to have implications for both human and environmental systems making change important to monitor. The launch of earth observing synthetic aperture radar (SAR) satellite systems allows detailed lake ice monitoring to take place, especially across large and inaccessible areas. However, these detailed records have yet to be used operationally.
Currently, the Canadian Ice Service monitors ice cover on a weekly basis for over 130 lakes across North America using a combination of SAR and optical imagery. Scenes are visually interpreted, and ice cover is reported as a fraction out of ten on a weekly basis for each lake. If an unsupervised, automated method of classification were made operational, detailed records of ice extent on these lakes could be provided at high spatial and temporal resolutions.
This paper presents a fully automated ice-mapping approach that integrates unsupervised segmentation from the Iterative Region Growing using Semantics (IRGS) methodology with supervised Random Forest (RF) labelling. The research assesses the effectiveness of the IRGS-RF approach and compares it with four other methods.
Methodology
The images used in this study were captured over Great Bear Lake, a large, deep lake located in the Northwest Territories, Canada. Thirty-six RADARSAT-2 scenes were used spanning three ice cover seasons between 2013 and 2016. Each image covered a swath width of 500 by 500 km, with a nominal spatial resolution of 100 m. Only scenes that included 70 per cent or more of the lake were used so that classification outcomes could be compared to the reported weekly fraction.
The IRGS algorithm, specifically designed to deal with the unique challenges present in SAR scenes of ice and water, was used to segment scenes (Figure 1). Using a watershed algorithm, the lake was divided into subregions or autopolygons. Within each autopolygon, small uniform regions were then distinguished using the watershed algorithm and SAR bands. The subsequent segmentation used an iterative process that merged and clustered regions towards an ideal configuration, dividing each into homogeneous regions of ice or water.
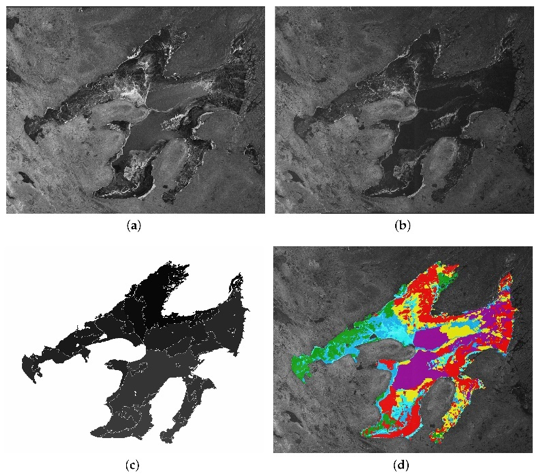
Figure 1: Steps of the IRGS segmentation approach for the scene from 2 December 2015. (a) HH polarization SAR image. (b) HV polarization SAR scene with brightness increased by 75 per cent. (c) HV image after autopolygon segmentation. (d) Segmentation where all segments are “glued” into the final chosen number of classes.
Following IRGS segmentation, three labelling methods were applied to perform ice-water classification: Manual, Support Vector Machine (SVM) and RF. SVM and RF classifiers were also tested without integration with IRGS. A flow chart of the proposed IRGS-RF automated ice-water classification method is shown in Figure 2.
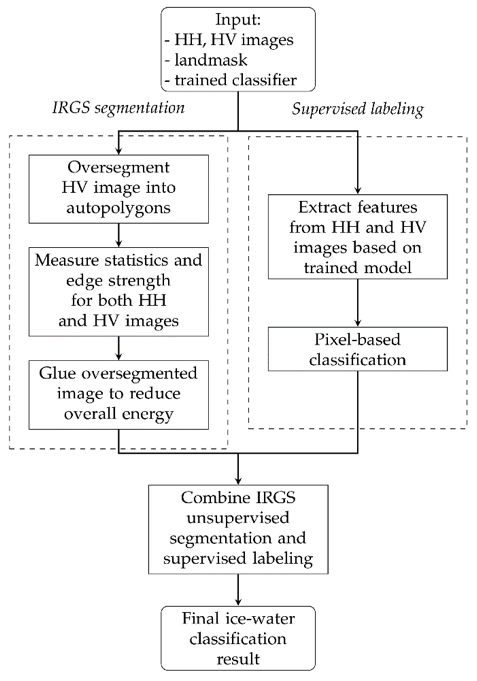
Figure 2: Flowchart of ice-water classification system. Inputs are images, landmask, and trained classifier (SVM or RF). The left block is unsupervised segmentation using IRGS, while the right block is supervised pixel-based labelling. The final classification result is the combination of segmentation and labelling based on majority voting.
Outcomes
Five classification methods were tested on 36 RADARSAT-2 scenes of Great Bear Lake and validated against 400 reference pixels per scene. The IRGS-Manual, RF, and IRGS-RF methods performed very well overall, each with an average accuracy of over 90 per cent. The IRGS-RF approach had the highest agreement with reference data, resulting in an average accuracy of 95.8 per cent. Box plots showing the spread of accuracy values for the tested methods by period and overall are included in Figure 3. The IRGS-RF approach outperformed the other methods tested and had a consistently high level of agreement with reference data independent of the period, with only one per cent difference between freeze-up and break-up accuracy.
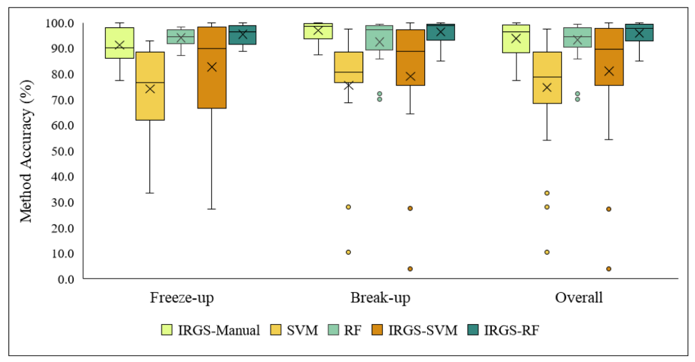
Figure 3: Box and whisker plots showing the distribution of classification accuracy values resulting from each method for the tested scenes and by period. Mean is represented by “x”. Outliers which exceed a value of 1.5 times below the first quartile are represented by dots.
The proposed IRGS-RF method achieved better performance compared with the other methods numerically, as well as upon further visual inspection. The IRGS step refines ice-water boundaries and suppresses ice error and water error. The scene of 27 November 2014 provides a good example of the performance for the different methods tested during freeze-up, when multiple signatures of ice and water are present (Figure 4). In this case, the IRGS-RF result had 98.5 per cent agreement with reference data, adequately capturing the three main areas of open water.
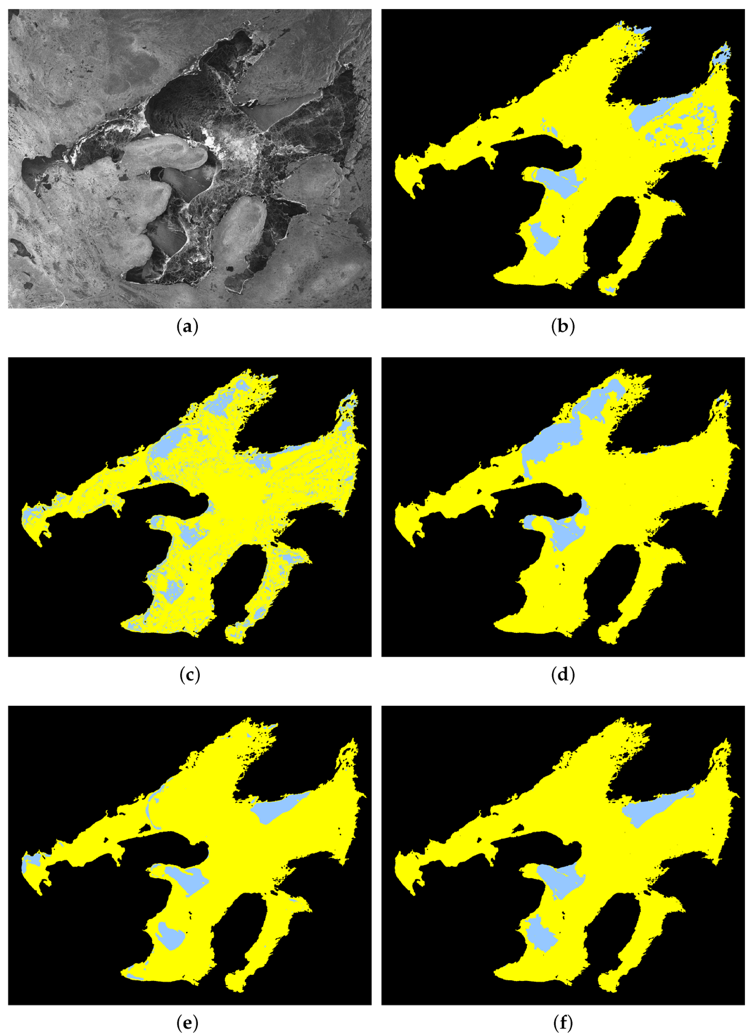
Figure 4: Ice-water classification of 27 November 2014 scene. Ice is shown in yellow and water in blue. (a) SAR image. (b) IRGS-Manual with accuracy of 86.0 per cent. (c) SVM pixel-wise classification with accuracy of 81.0 per cent. (d) IRGS segmentation labelled by SVM with accuracy of 84.8 per cent. (e) RF pixel-wise classification with accuracy of 94.3 per cent. (f) IRGS segmentation labelled by RF with accuracy of 98.5 per cent.
Conclusions
The automated IRGS-RF method was proposed to classify lake ice and open water using RADARSAT-2 scenes of Great Bear Lake. The method achieved an overall accuracy of 95.8 per cent and performed reliably well across both the freeze-up and break-up periods, making it a robust classification tool for operational use. RF labeling minimized the need for visual interpretation, a key advancement required to process the vast amount of imagery becoming available from recently launched SAR missions.
Although the proposed method achieved good results, limitations do exist including required processing time and some ice and water error in early spring. It has been noted that supervised classification algorithms often only perform well on specific geographic regions based on training data and thus cannot be widely applied without regional validation. Future work should test the IRGS-RF method on a larger dataset including multiple lakes at several latitudes and locations, training and testing the model under a variety of scenarios. This will further test the robustness of the method for operational use.
Hoekstra, M., Jiang, M., Clausi, D.A. & Duguay, C. (2020). Lake ice-water classification of RADARSAT-2 images by integrating IRGS segmentation with pixel-based random forest labeling. Remote Sensing, 12(9), 1425. doi: 10.3390/rs12091425
For more information about WaterResearch, contact Allie Dusome.


