To utilize data visualization as a means to help create compelling narratives, improve accuracy and efficiency, and evolve data-driven design and problem solving
Technology & Design
Description
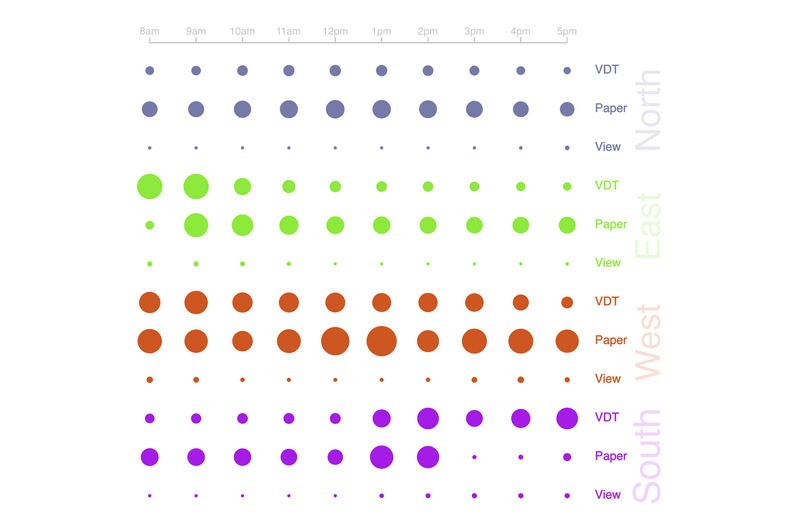
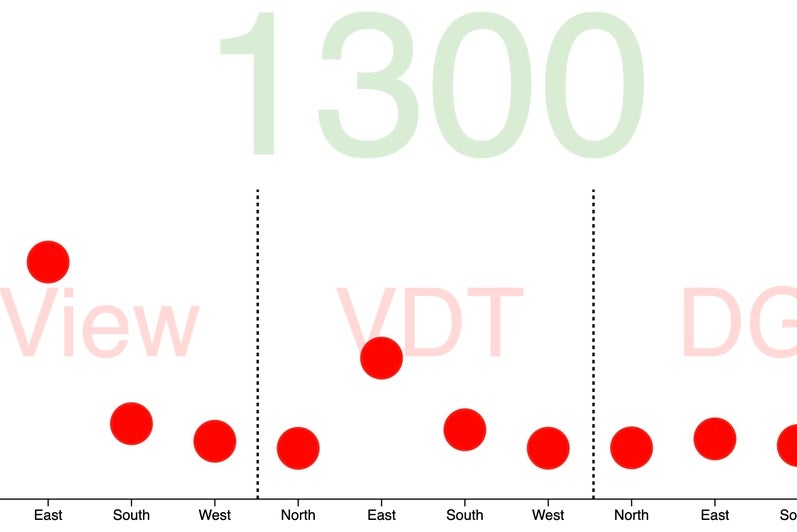
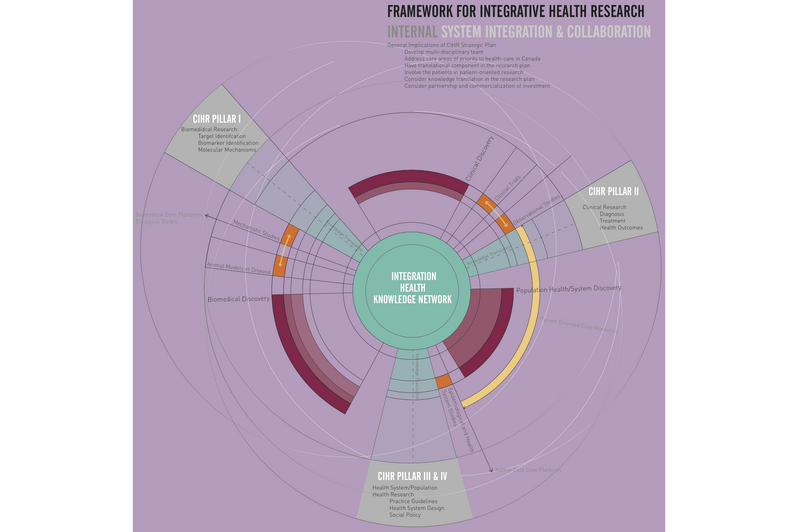
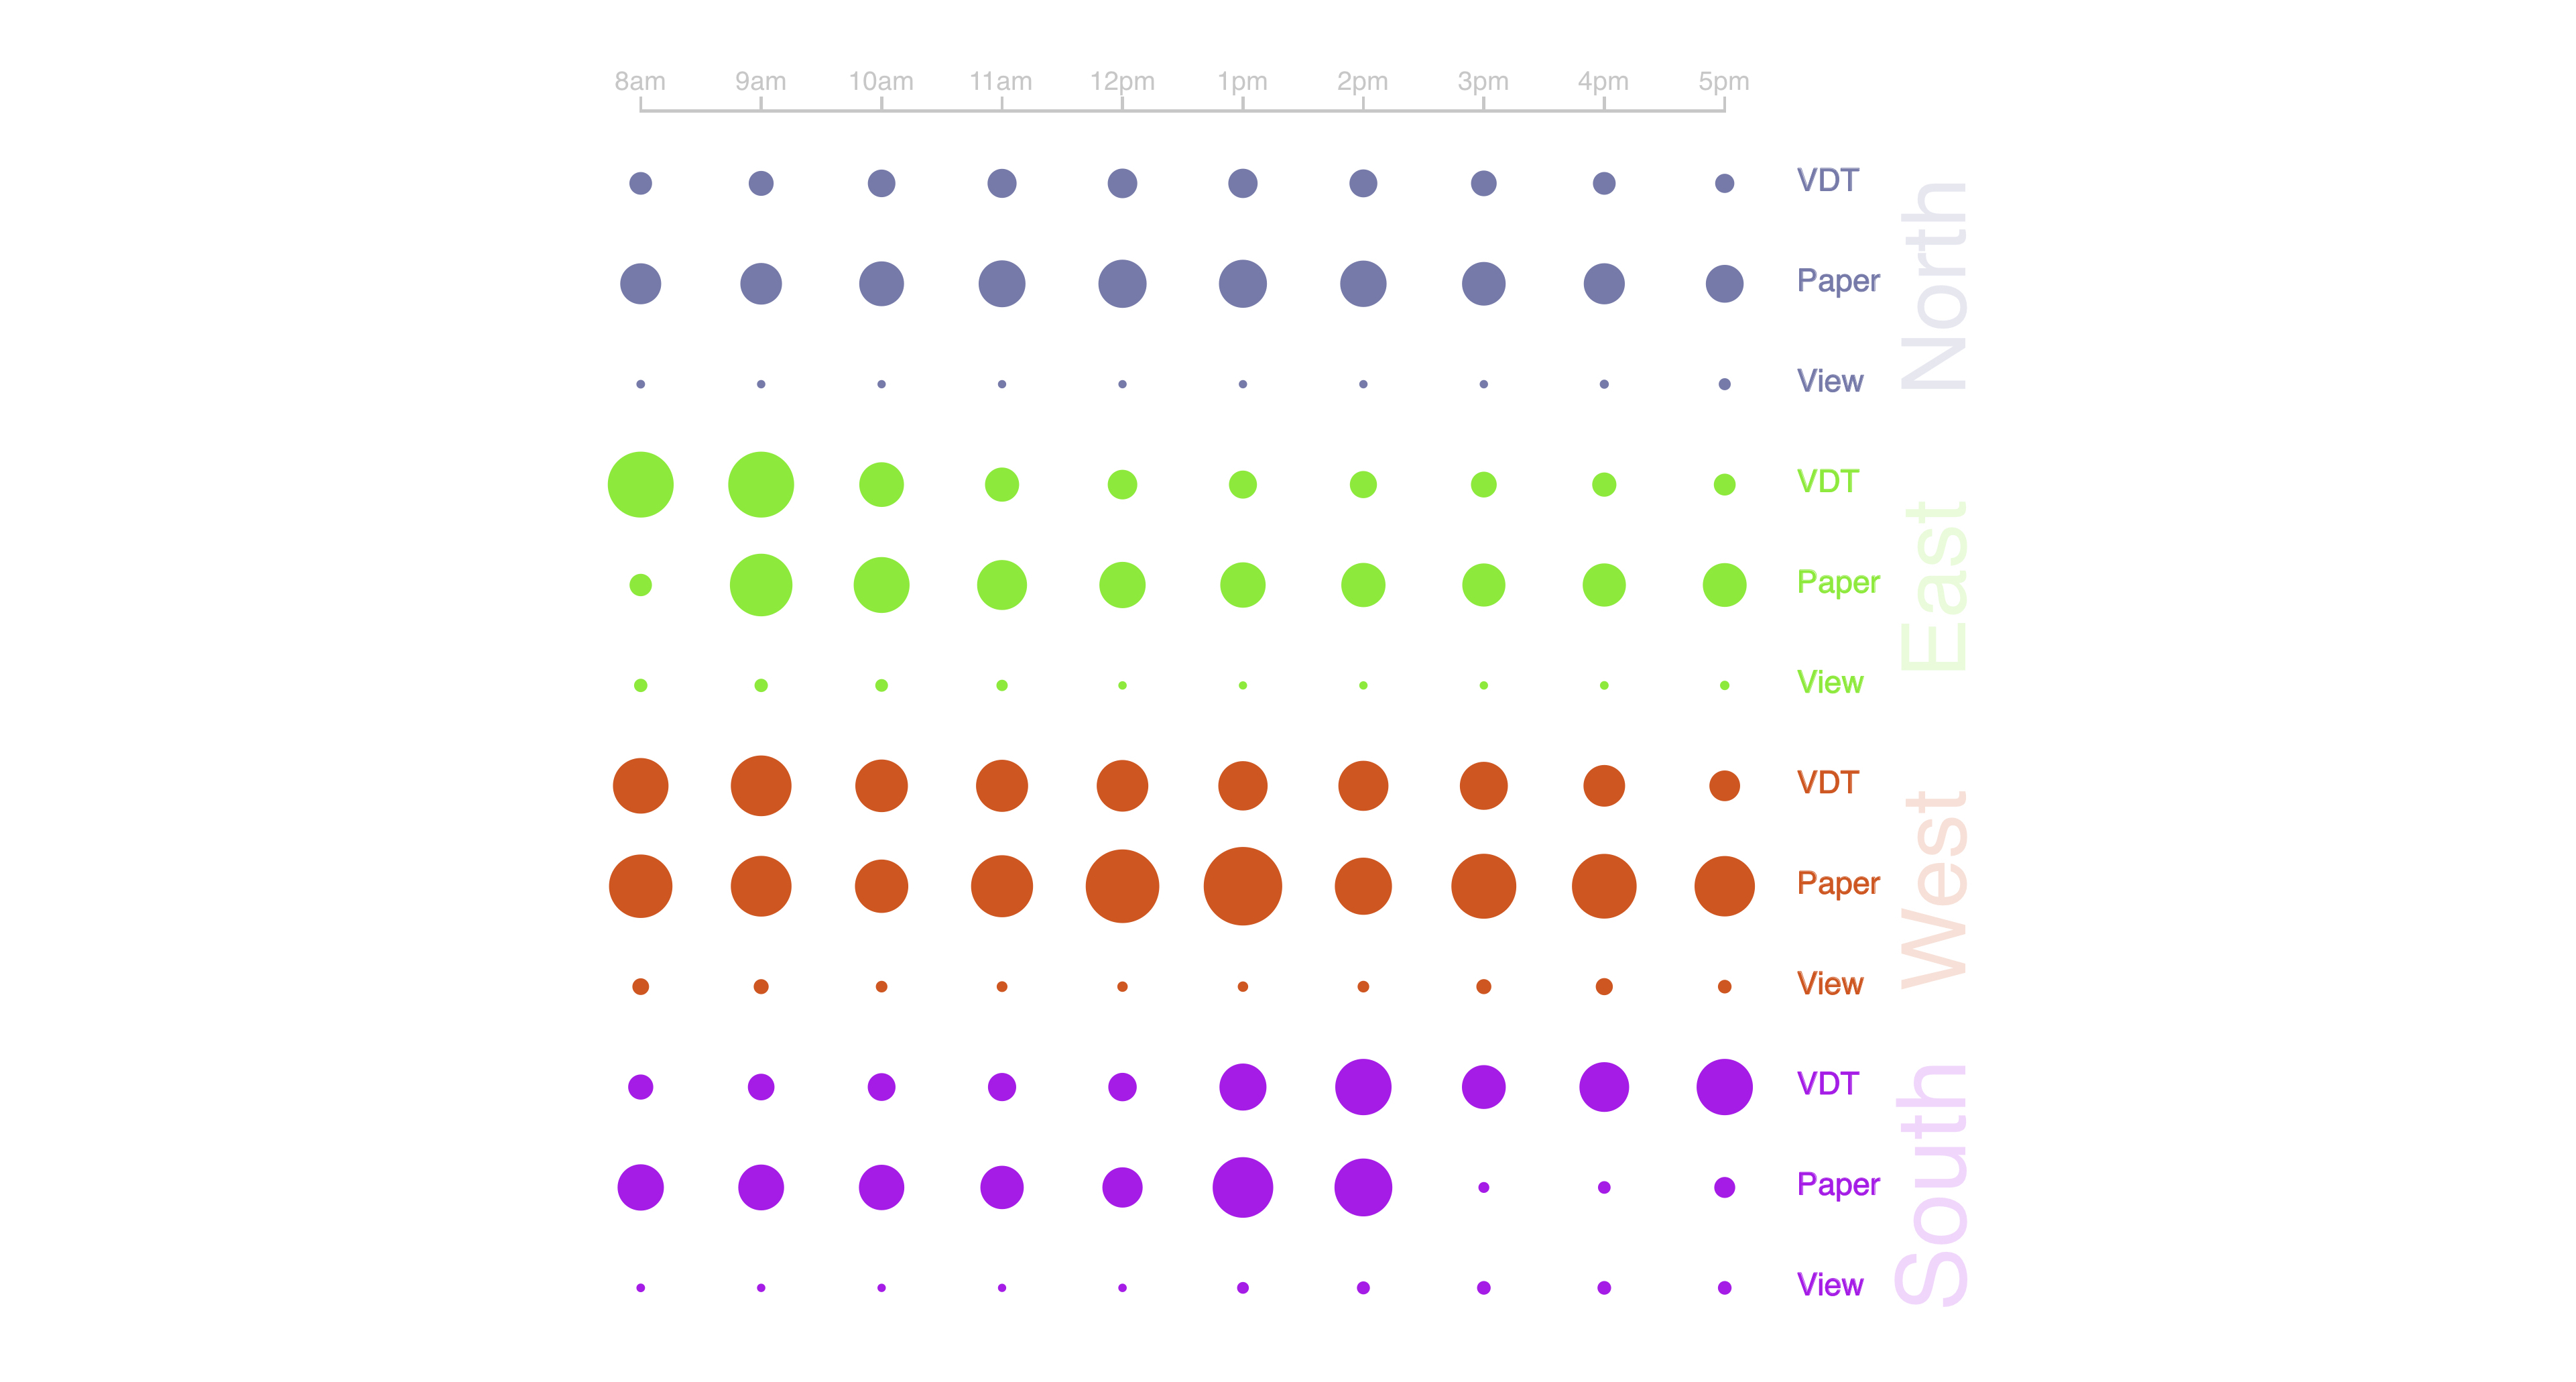
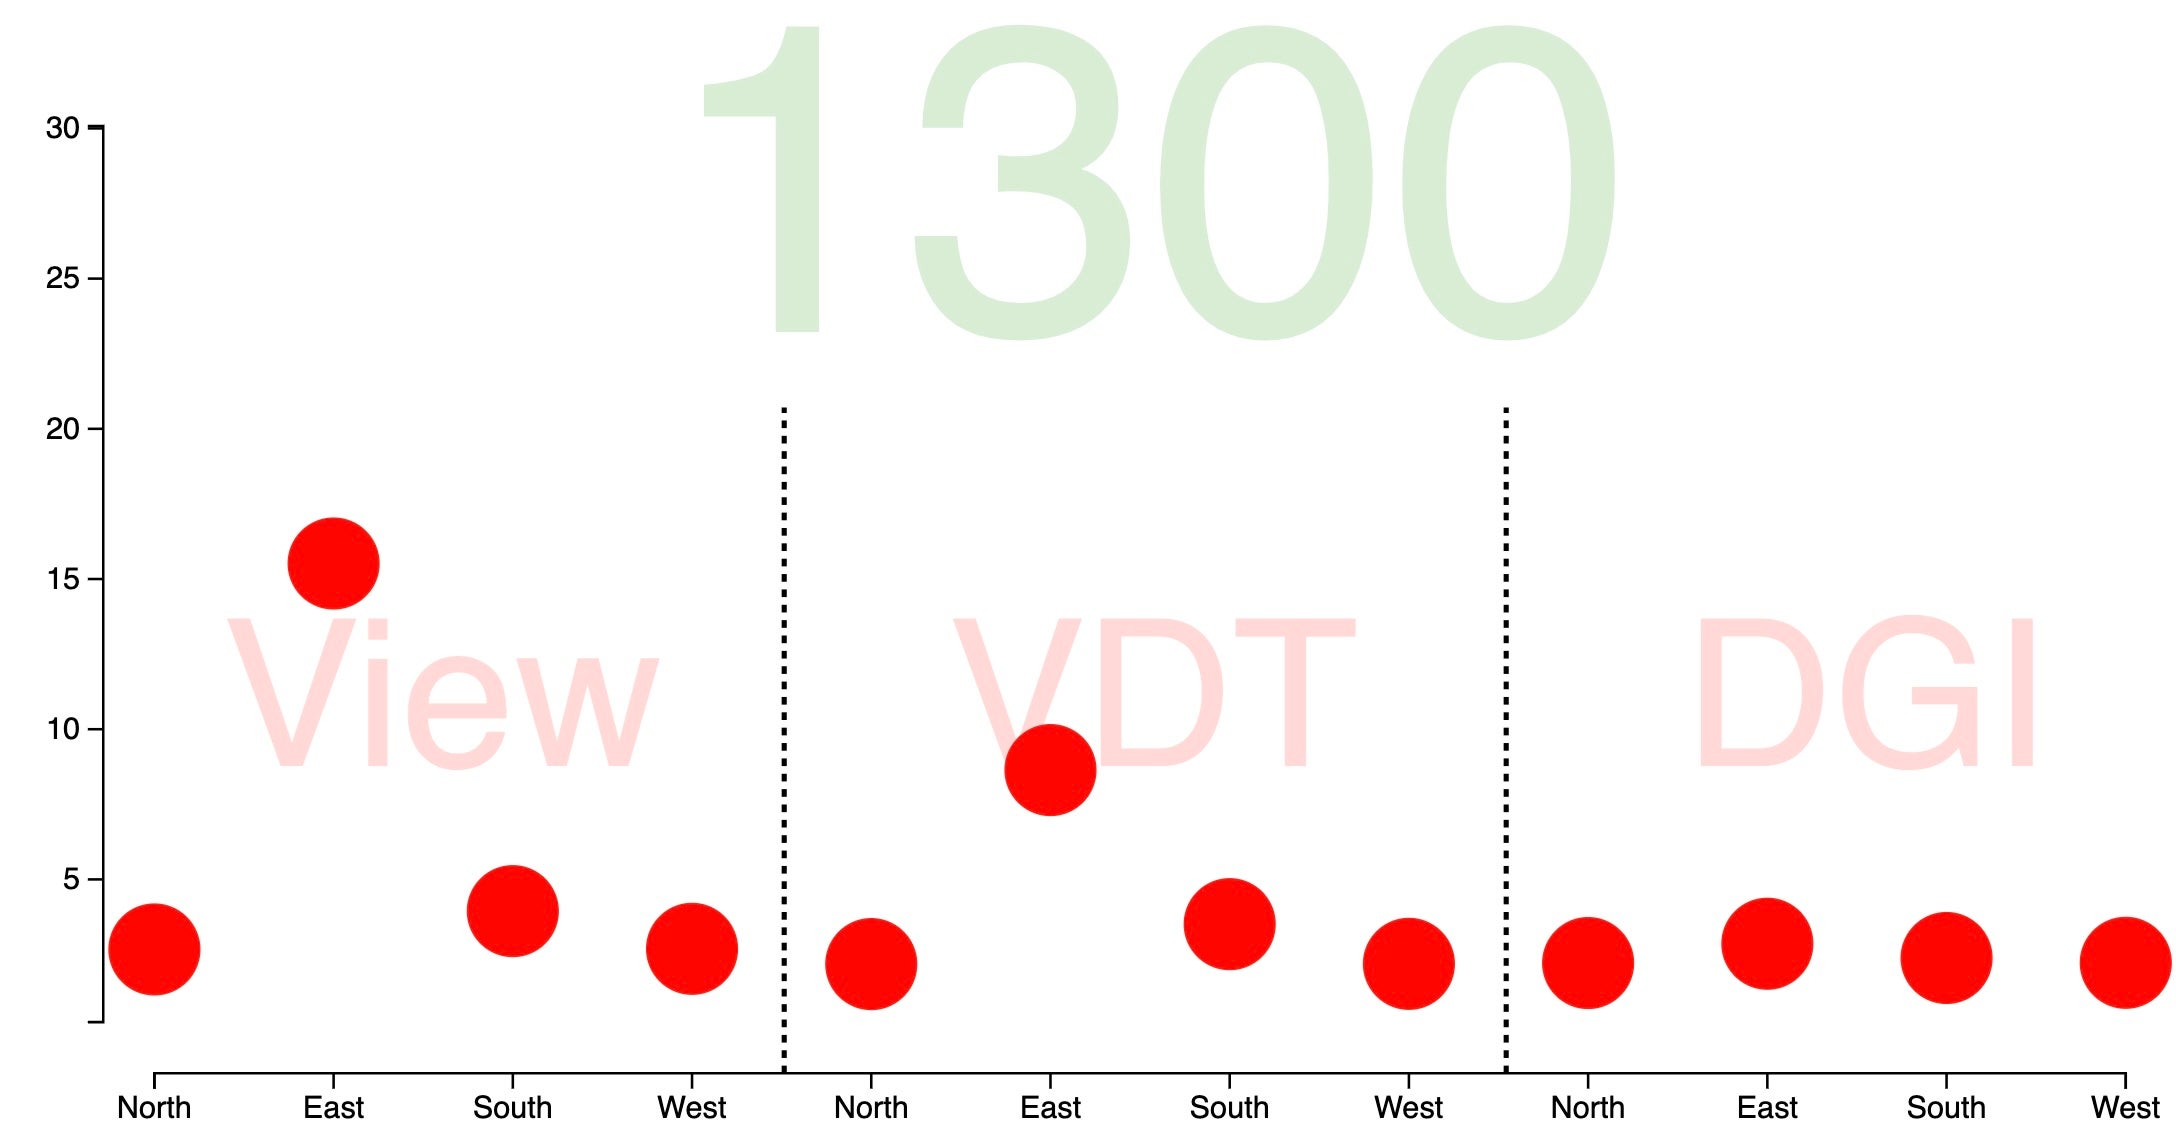
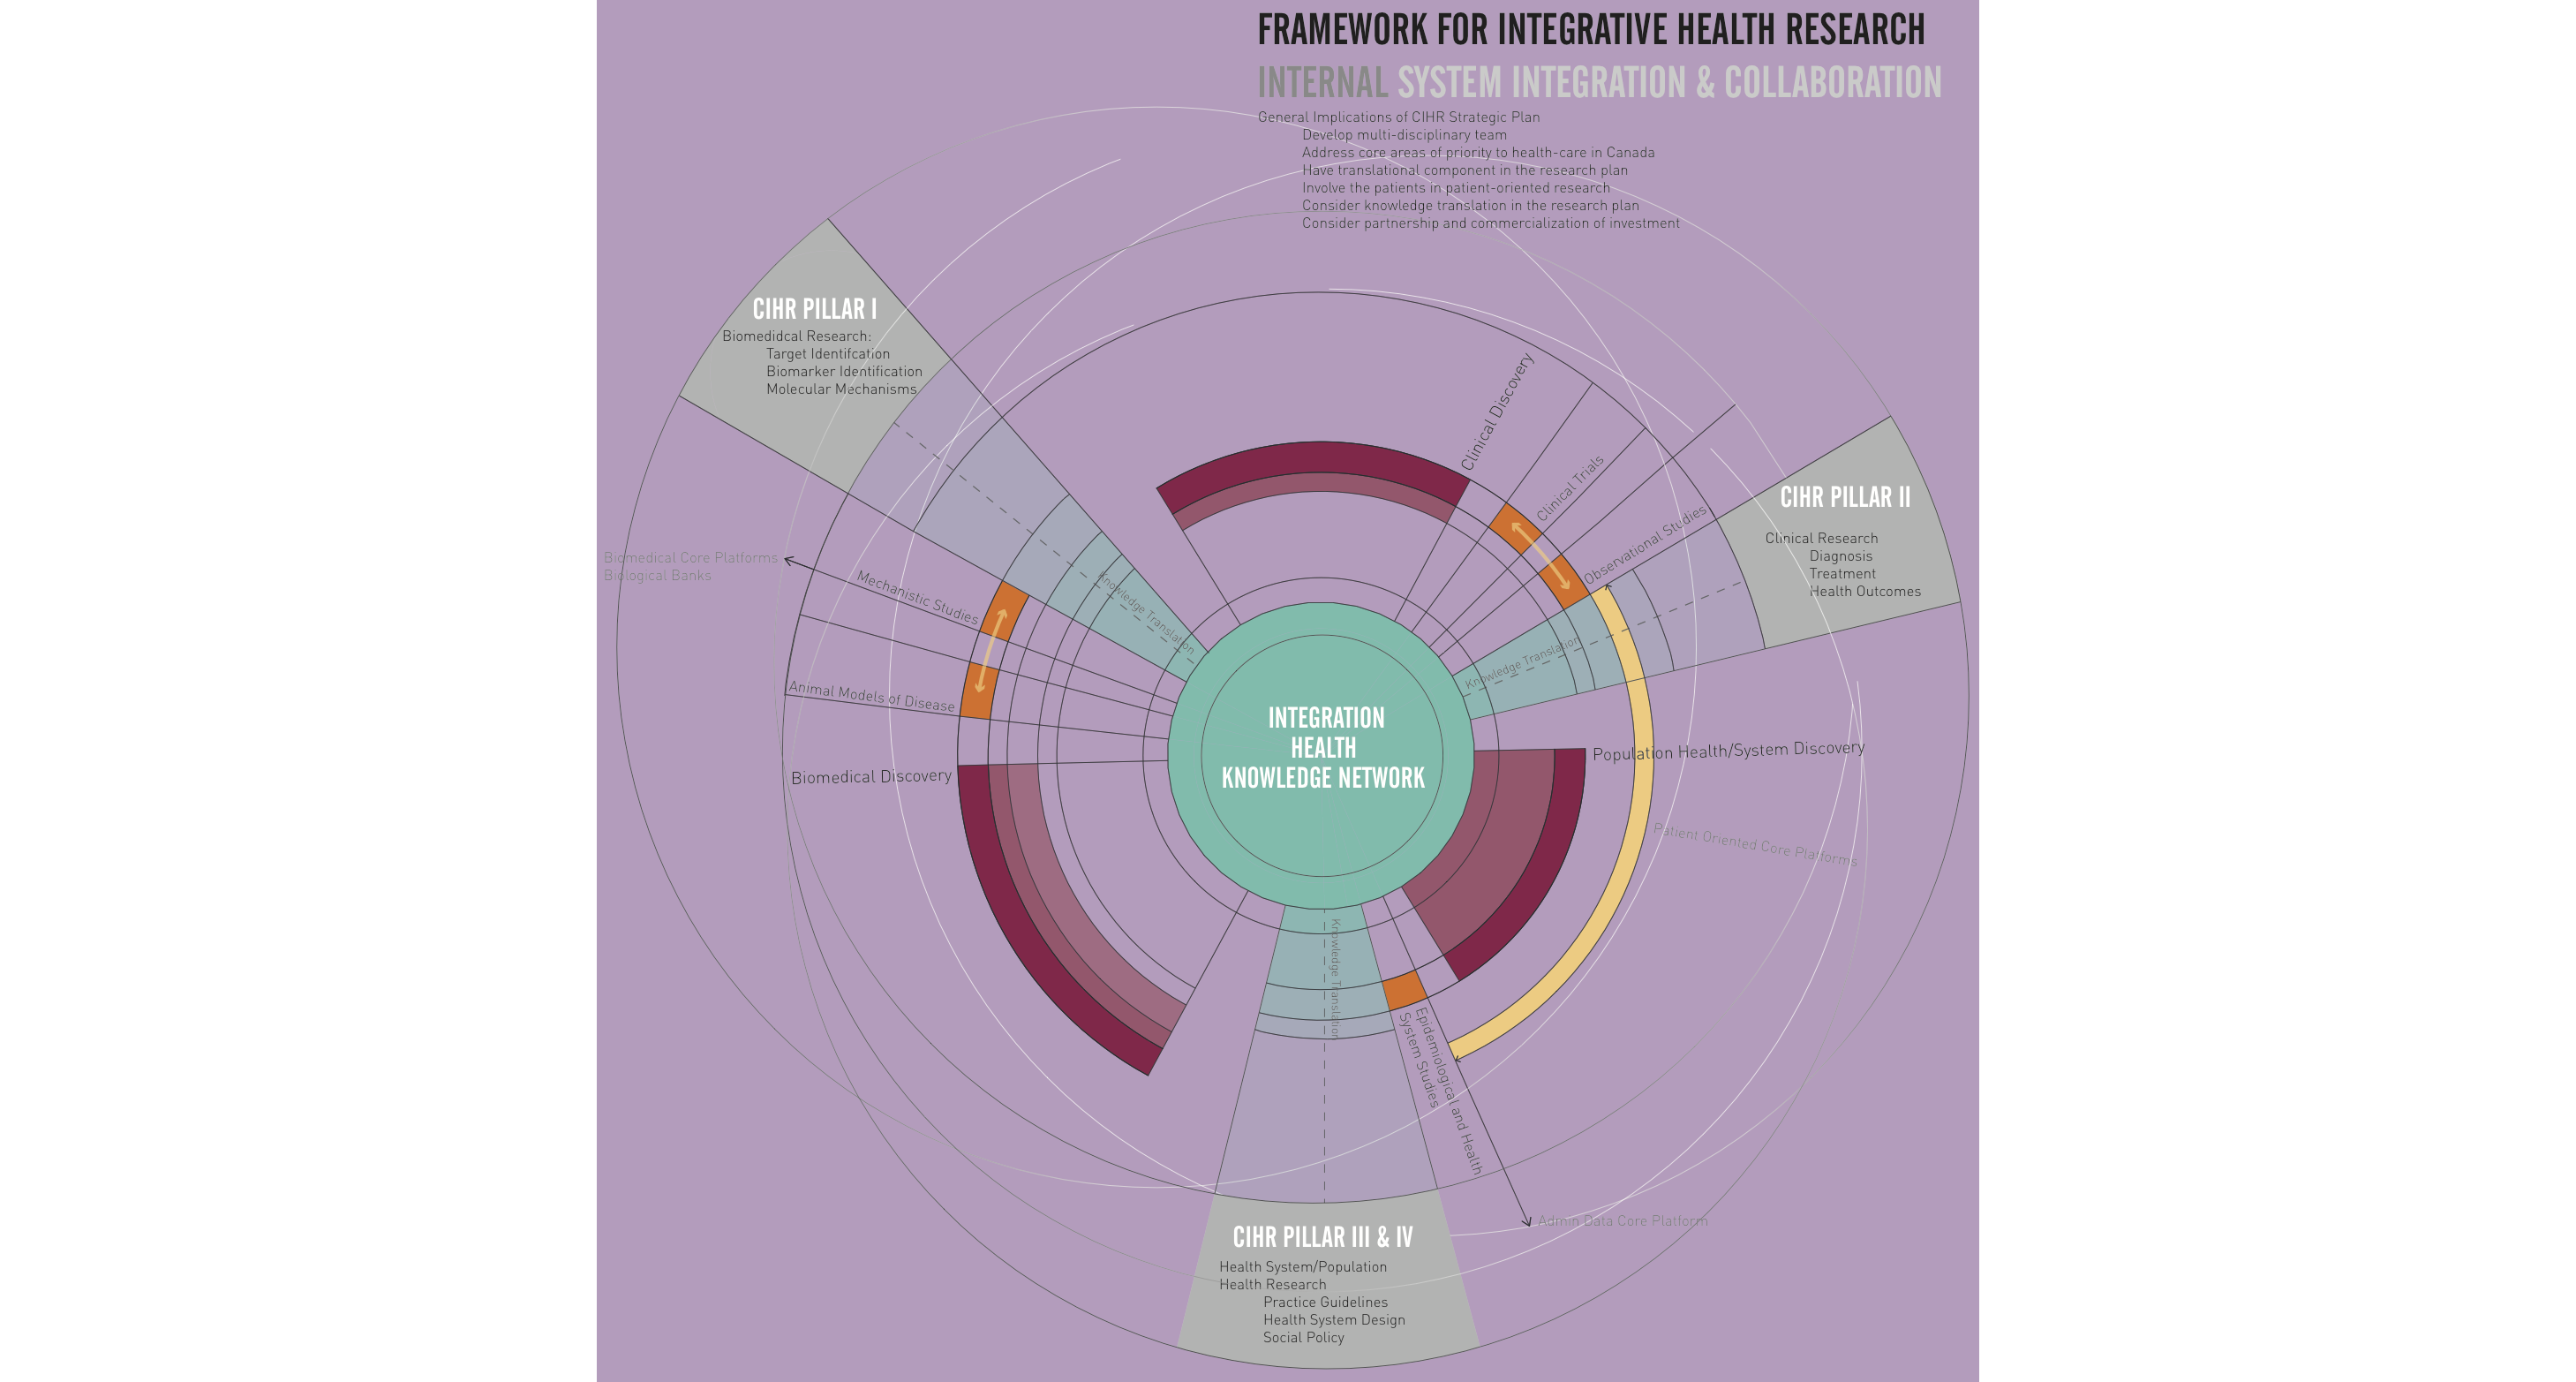
This project evolves instructional and pedagogical development in Architecture. While data visualization becomes more available, it can be overwhelming to put into use, particularly for designers learning who take multiple layers of information into effect. In Architecture, data sampling is executed, prior to design, to amass as much information to educate students on a project site. The exploration typically ranges from historical backgrounds and demographic statistics to environmental study, infrastructure analysis and even codes and constraints. With such broad range of context examined, the dataset is often huge, multi-layered and complex. Data visualization offers multiple ways to format and organize huge dataset into a diagram of comprehensive information. This project intends to foster the understanding and making of effective data visualization. The goal is to manifest the dominance of visual aid that it can bring upon designers and their lessons effectively and efficiently. The content will respond to two primary factors of data visualization: design problem and design pattern.
