Stormwater sediments reveal a record of urban microplastic pollution
By Amir Reshadi and Hang Nguyen
In urban areas where there is a higher level of concentrated human activities, microplastics tend to build up in the sediments of stormwater retention ponds (SWPs), man-made structures designed to capture surface water runoff. These ponds often function as barriers between urban centers and natural areas (Figure 1). The sediments from these ponds can therefore reveal the number and type of microplastics coming from surrounding land uses. To help us better understand the past, present, and future of microplastic pollution through SWPs, our team collected samples from five stormwater catchments in the City of Kitchener. We then processed them by separating the microplastics from sediments and inputted the results, as well as water column data, to a computer model to determine changes in abundance and shape of microplastics within and between the sampled SWPs.
The goal of this work, funded under the Microplastics Fingerprinting project, is to determine how many microplastics are escaping stormwater ponds and being transported downstream into rivers and lakes. We’re using the EPA-SWMM model, which allows us to evaluate how different land uses, such as residential, commercial, industrial, and transportation, influence microplastic discharge rates in each of the five catchments (Figure 2).
We found that the catchments characterized most by industrial land uses contributed the highest levels of microplastic pollution to SWPs. In fact, the rates were twice as high as the next type of land use – residential (Figure 3). Commercially-dominated areas had the lowest microplastic accumulation rates. We also identified roads as a significant source of microplastic pollution due to tire abrasion. We also found that fibers make up 30% of microplastic concentrations, with fragmented plastic making up the remaining 70%. This suggests that denser microplastic fragments settle much faster into sediments, whereas lighter fiber fragments tend to float on the surface.
Moving forward our plan is to collect more water samples on a monthly basis. We hope this reveals more about the sources of microplastic pollution. One hypothesis is that a detectable amount is coming atmospheric deposition, so we have added atmospheric deposition samplers to the weather station on the University of Waterloo campus to provide additional data needed for this type of analysis. Monthly samples will also tell us if there are seasonal variations in accumulation rates and microplastic types.
We are also expanding the model to cover the whole city of Kitchener so that we can see if and how microplastics from SWPs are making their way into the Grand River and eventually Lake Erie. We hope this work on microplastic pollution transport can help cities optimize the design of SWPs to mitigate microplastic pollution.
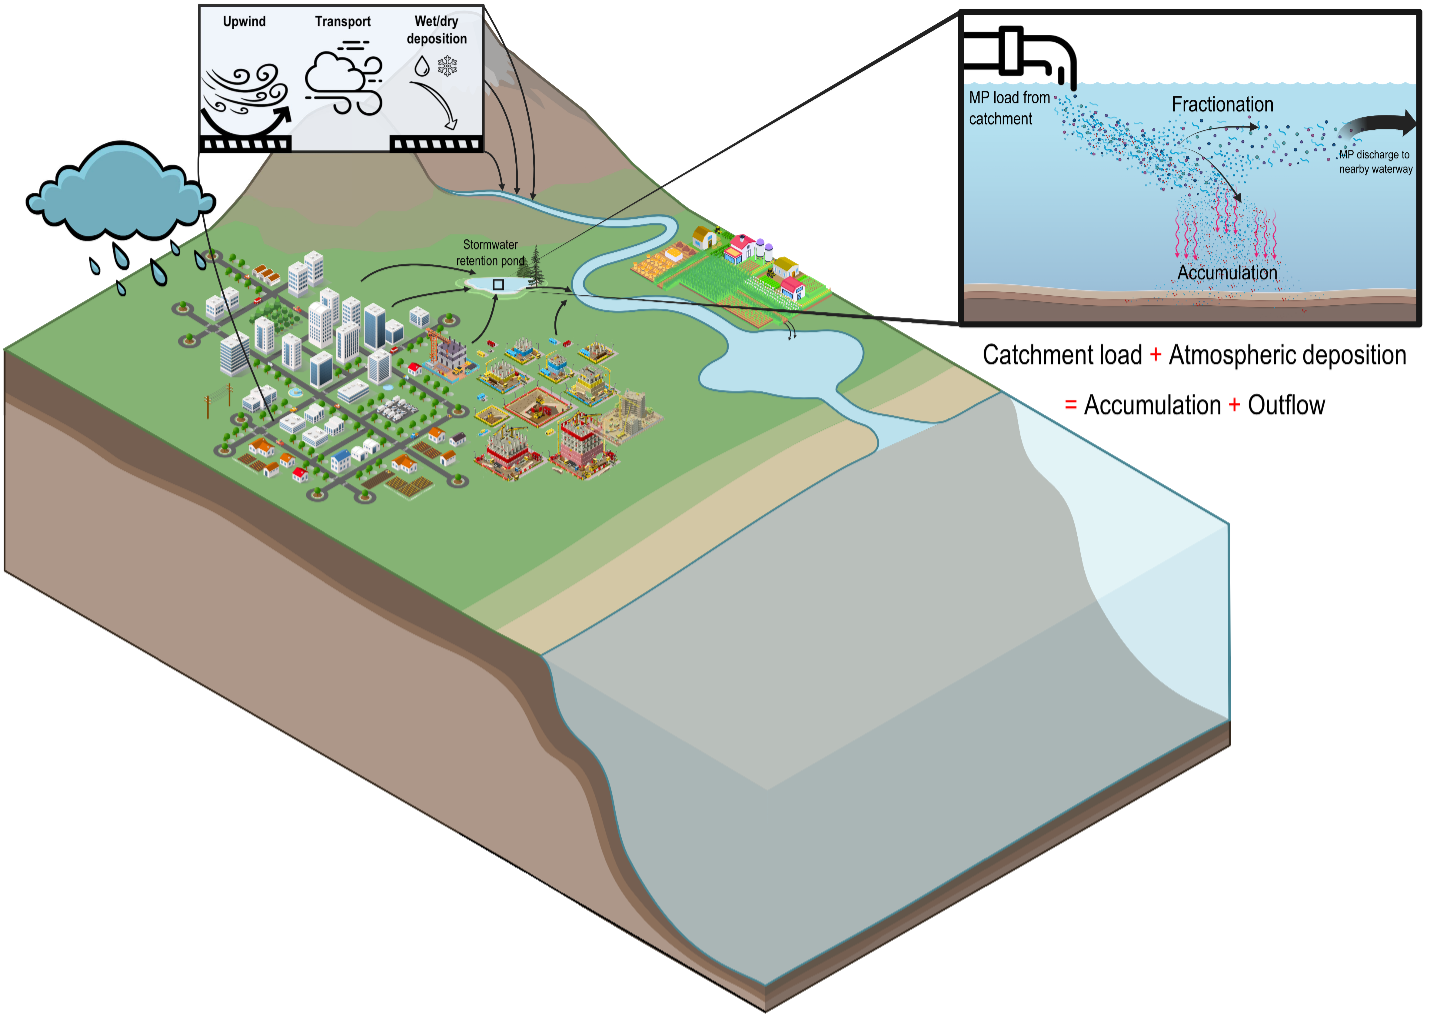
Figure 1: Conceptual figure of a typical stormwater retention pond showing microplastic transport.

Figure 2: Example of an output from ArcGIS showing the characterization of different land uses based on a built-in machine learning algorithm.
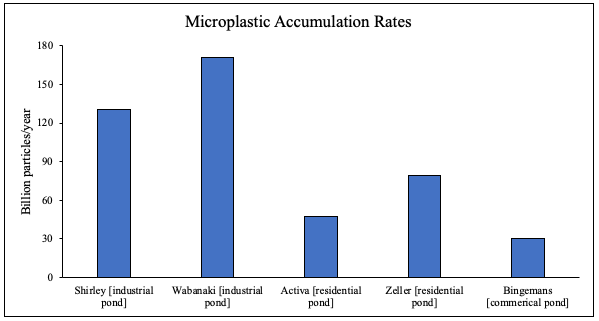
Figure 3: Microplastic accumulation rates (particles/year) in five.