Tuesday, February 5, 2008
I’ve been hard at work adding more realistic element to TourSim. Some of the highlights include:
- Seasonality: Certain accommodation and activity types (like camping and boating) are now active only from May 1st to October 1st. All ferries now operate according to their schedules as well.
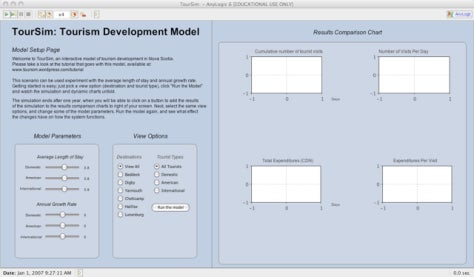
- Adjustable length of stay: Slider bars allow the user to set the average length of stay for each of three types of tourist (domestic, American, and international). This lets you see the effect of greater retention of tourists compared to a high turnover. The default setting is 3.8 days per tourist.
- Tourism growth rate: Again, slider bars let you increase or decrease the total numbers of tourists entering the model. The default settings create a scenario similar to 2007 values.
- Model view choices and dynamic charts: Select one of six different destinations, and one of three different tourist types. You can also select provincial values to be shown in four charts (total visitation, visitation per day, total expenditures, and average expenditure per tourist).
- Activity and Accommodation choice charts: dynamic pie charts show the percentage of tourists that choose a particular activity or accommodation. This selection changes depending on your destination selection.
- Tourist routes: The routes that tourists follow grow dynamically as the model runs. You can also select a zoomed-in view of Cape Breton.
- Hotel development at Baddeck: You now have a choice to run the model with the existing range of accommodations, or add a seasonal (may-october) hotel at Baddeck.
You can take a look at this most recent model by visiting the Tourism Scenarios section. Since this new version is substantially improved compared to the older versions, I’ve relegated those versions to an ‘archive’ section. Stay tuned for upcoming scenarios that focus on more detailed product development.
