While there is quite a bit of interest in several fields in agent-based models (ABMs) as an approach to studying issues such as resilience, and thresholds, their complexity and technical nature is a significant barrier to their use. I’ve had a number of discussions with McGill professor Dr. Garry Peterson about alternate modeling approaches. One technology that he uses in both classes and in his publications is a simple Excel spreadsheet. I’m constantly amazed by the functionality that is included in Excel, and have even seen some simple ABMs built using it.
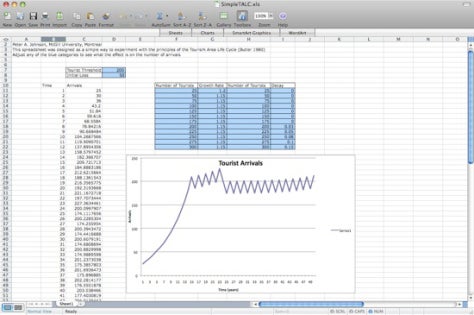
I’ve put together a simple tourism area life cycle (TALC) in Excel and would appreciate any feedback. Although I use the term TALC (tourism area life cycle, after Richard Butler’s seminal work), the only real similarity is that I’ve added a level of capacity to the model. I’m intending this as just a simple toy to facilitate thinking about tourism dynamics, thresholds and resilience. You can experiment with tourist growth rate, decay, threshold, and the effects of the threshold.
Let me know whether you think that this type of tool would be useful as a teaching or research aid? What other dynamics or interactions would be useful to incorporate into a simple model such as this?
Update: This spreadsheet is one of the more frequently visited parts of my blog, so I’ve decided to put some more effort into it. I’m taking a look at some neat visualization strategies with Google Docs, so expect some changes and a new post very soon.