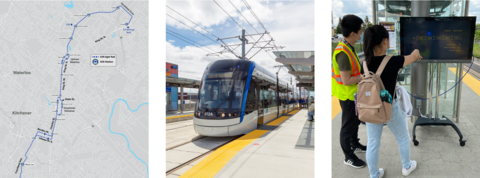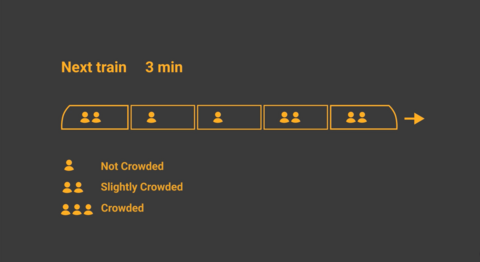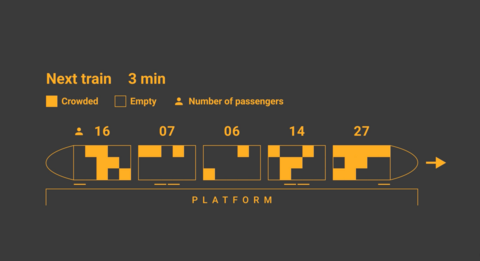
Field testing of our crowding information visualization prototypes at ION Light Rail Stations in Kitchener-Waterloo.
In collaboration with Rogers Communications and Halion Displays, we developed a public information visualization for displaying crowding information to increase ridership through a socially safe user experience for public transit riders.
Description:
Due to the COVID-19 pandemic, ridership has dropped amidst safety concerns around sharing public transportation. We investigated the public transit rider experience and perceptions of safety based on levels of crowdedness on a bus or train. The study included two parts. The first part is a survey about passengers’ safety perceptions and practices, perceptions of levels of crowding, and preferences for visualizing crowdedness information based on the presented design concepts. The second part is a field evaluation of information visualization concepts on digital public displays that help riders anticipate crowds on trains, and the development of a thermal camera-based crowd detection system. The results of the studies aim to inform designing risk communications surrounding crowdedness and other safety information to public transit riders.

