Michael Seasons
School of Planning, University of Waterloo
It is often noted that around 80 percent of the Canadian population lives in urban areas — but new research suggests Canada is actually a “suburban nation”.
A research team lead by Professor David Gordon, Director of the School of Urban and Regional Planning at Queen’s University, is contributing to the conversation on the changing nature of Canada’s suburbs. Gordon and his team have used census data from 1996 and 2006 to analyse all Census Metropolitan Area’s (CMAs) across the country, as well as a sample of Census Agglomerations (CAs). They apply multiple definitions to GIS data at the census tract level in order to produce a series of maps and tabular data by city that estimate the suburban population.
The team notes that the statistic that most of us live in cities rests on a division between urban and rural: if you are not living in a rural area, then you are said to be part of the urban population. While this can be a useful distinction to help us understand changes in settlement patterns, it tells us very little about how people are living within urban areas. The work done by Gordon’s team points to the reality that while the majority of us live in cities, this does not necessarily mean we are living in the same type of context. Their research helps us estimate how many people are living urban versus suburban kinds of lives. Their work recognizes that there are multiple definitions of what constitutes “suburban” but that for the purposes of measurement, ultimately a definition must be chosen. They estimate that around two-thirds of Canadians are living in what would be considered suburban neighbourhoods based on definitions using commuting patterns and density as indicators of suburbanisms.
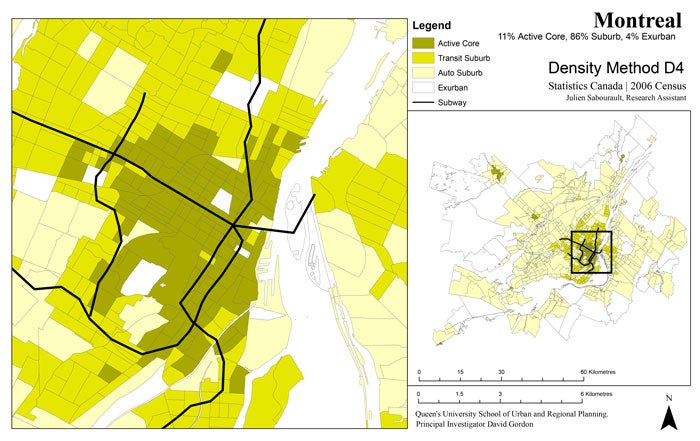
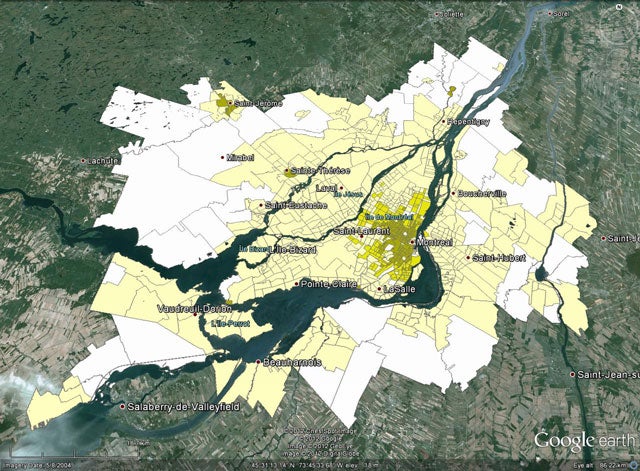
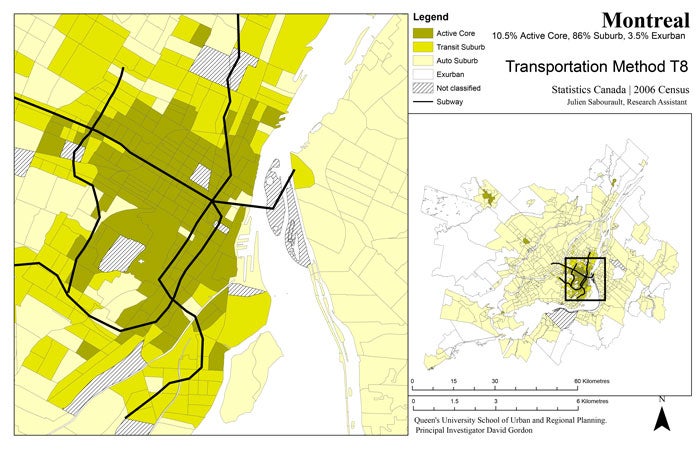
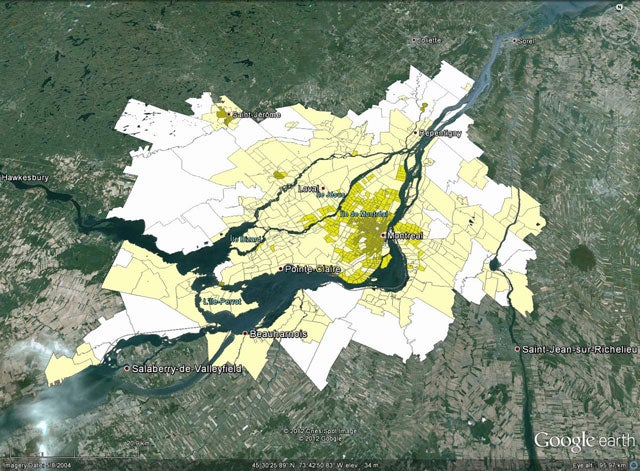
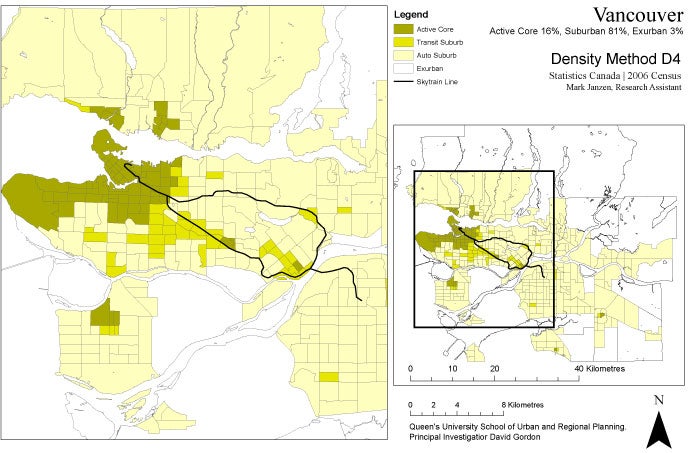
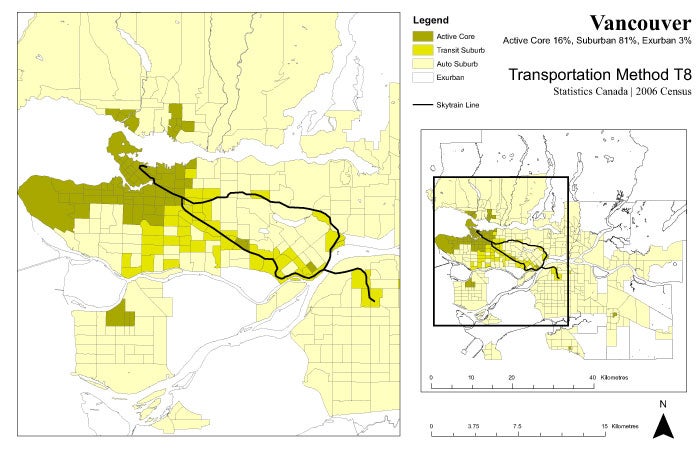
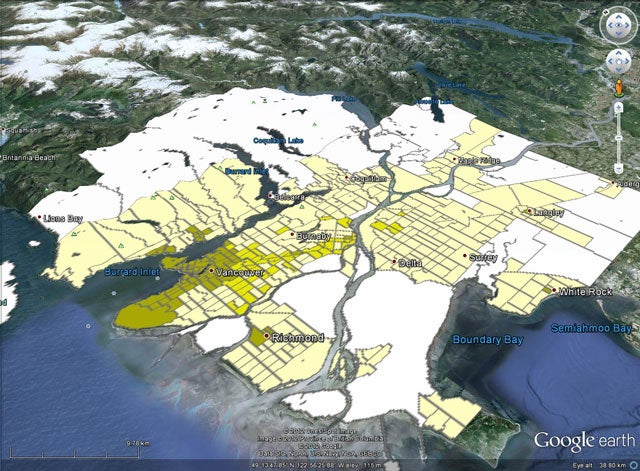
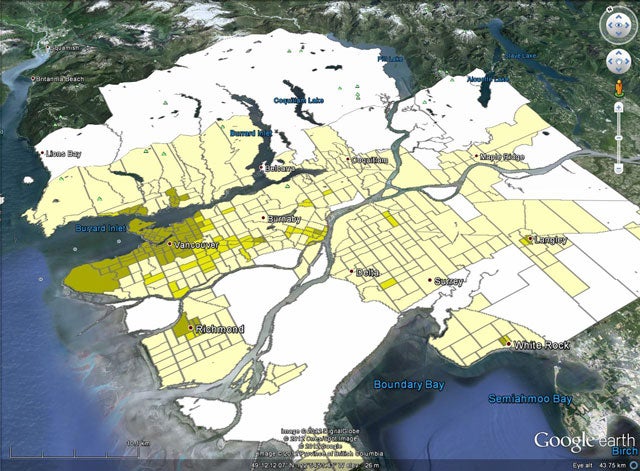
We have included several sample maps for Montreal, Toronto and Vancouver. The maps use two different methods based on the 2006 census data: the “Density” method classifies census tracts by their potential for transit use based on population density, whereas the “Transportation” method classifies census tracts by the dominant mode of transportation used to travel to work. Using these two methods, Gordon and his team divide cities into four areas: “Active Core”, “Transit Suburb”, “Auto Suburb”, and “Exurban”. In addition to PDF map files of census tract maps, Gordon’s team has also presented their data using Google Earth.
Montréal

Suburban nature of Montréal, using Gordon’s “Density” method.

Suburban nature of Montréal rendered in Google Earth, using Gordon’s “Transportation” method.

Suburban nature of Montréal, using Gordon’s “Transportation” method.

Suburban nature of Montréal rendered in Google Earth, using Gordon’s “Density” method.
Toronto

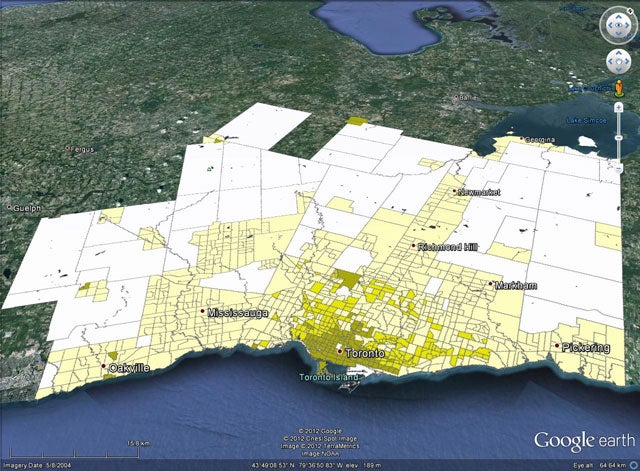
Suburban nature of Toronto rendered in Google Earth, using Gordon’s “Transportation” method.

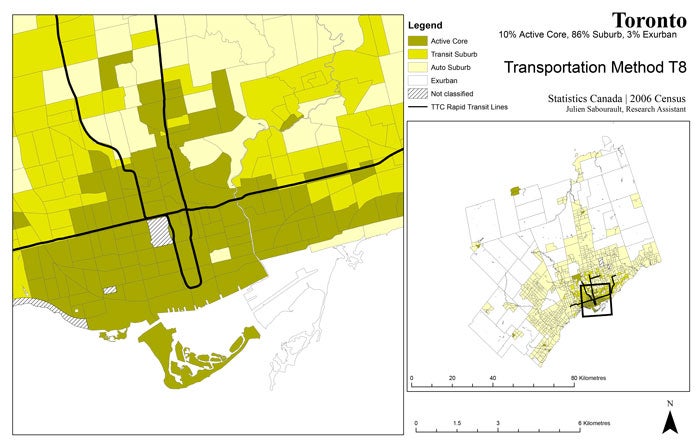
Suburban nature of Toronto, using Gordon’s “Transportation” method.

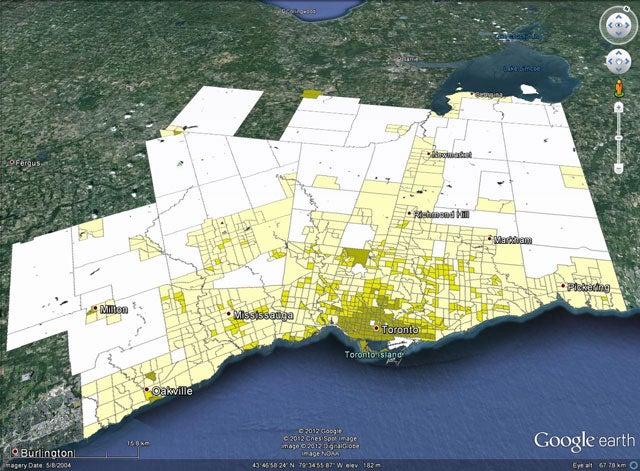
Suburban nature of Toronto rendered in Google Earth, using Gordon’s “Density” method.

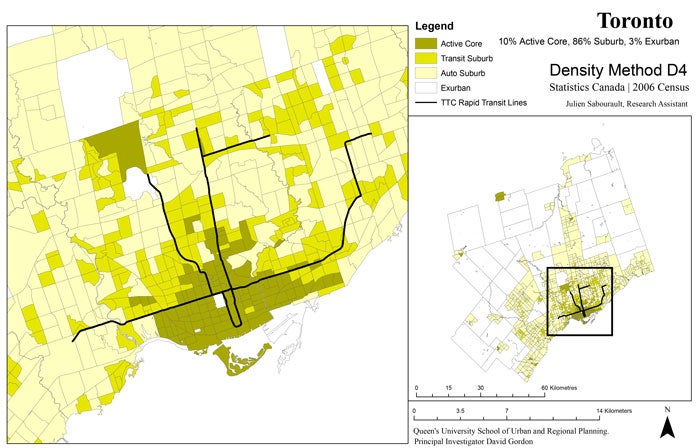
Suburban nature of Toronto, using Gordon’s “Density” method.
Vancouver

Suburban nature of Vancouver, using Gordon’s “Density” method.

Suburban nature of Vancouver, using Gordon’s “Transportation” method.

Suburban nature of Vancouver rendered in Google Earth, using Gordon’s “Transportation” method.

Suburban nature of Vancouver rendered in Google Earth, using Gordon’s “Density” method.
To read more about David Gordon’s project, or to access the original PDF maps and Google Earth files, head over to the project website.