University of Waterloo WiM's mission is to encourage and advocate for women+ people (women and gender minorities) who study and work in mathematics. To justify the relevancy of this pursuit, we provide statistics about the makeup of the university's student body and staff from the University of Waterloo Equity Survey and demographic information from Quest. Below you can find data to support three key takeaways:
- Women+ graduate and undergraduate students are underrepresented in the Faculty of Math, and this ratio has not significantly improved from Fall 2019 to Fall 2024. In fact, the ratio of women+ math undergraduate students has moderately decreased in this time frame.
- Women+ employees are underrepresented in the Faculty of Math compared to women+ employees in the University of Waterloo overall.
- Within Waterloo's Faculty of Math, women+ are underrepresented in academic positions compared to staff positions.
Information about our sources, including the raw data we obtained, is available at the bottom of this page. In all of our graphs, we use "women+" to include both the "woman" and "another identity" categories.
Gender representation in Waterloo math students over time


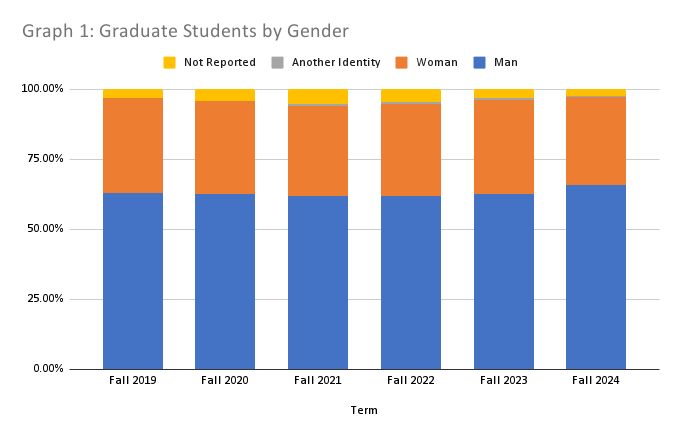
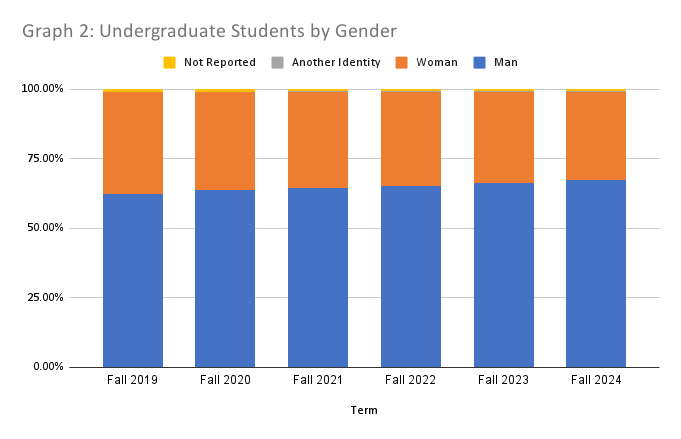
Graph 1 and Graph 2 depict the gender identities of graduate and undergraduate math students, respectively, at the University of Waterloo. Graph 1 shows that from Fall 2019 to Fall 2024, the average percentage of women+ graduate students in math remained between 32% and 34%. Likewise, Graph 2 shows that in this same period, the percentage of women+ undergraduate students decreased each year from 37% in Fall 2019 to 27% in Fall 2024. This data demonstrates that gender representation for all Waterloo math students is a persistent problem.
Gender representation in the Faculty of Math compared to the University of Waterloo overall
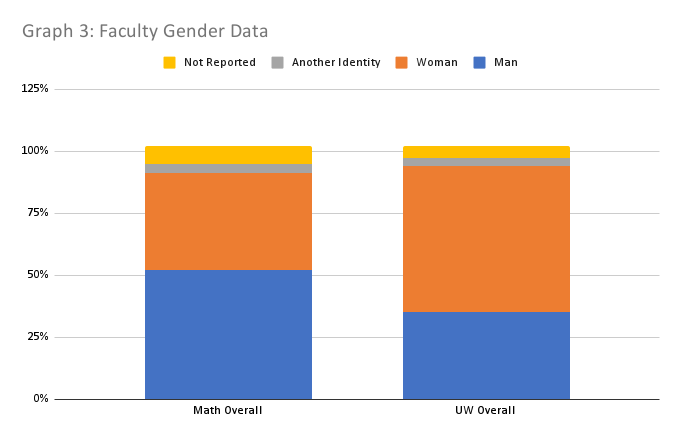
Graph 3 depicts the gender identity of employees in the Faculty of Math versus the employees of the broader campus. Note that participants were allowed to pick more than one option, resulting in totals higher than 100%. The leftmost column shows that, of those who reported their gender, approximately 43% of employees in the Faculty of Math identify as women+, whereas the column on the right exhibits that 62% of employees in the overall university identify as women+. This demonstrates that the underrepresentation of women+ employees is an issue faced by specific faculties at the University of Waterloo, such as the Faculty of Math.
Gender representation for University of Waterloo employees in the Faculty of Math
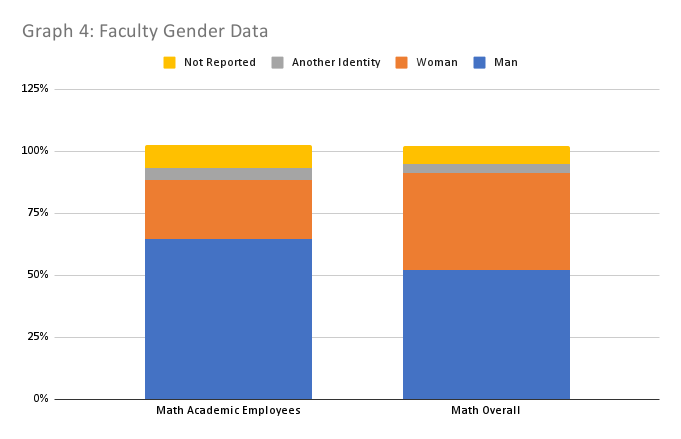
Graph 4 shows the distribution of gender identity among the employees of the Faculty of Math. As in Graph 3, participants were allowed to pick more than one option, resulting in totals higher than 100%. The leftmost column pertains to only academic math employees and shows that, of those who chose to report their gender, 29% identify as women+. On the other hand, the column on the right includes both academic employees and staff within the Math Faculty and shows that, of those who chose to report their gender in the overall faculty, 43% identify as women+. This difference demonstrates a division of labor in the Faculty of Math that falls along traditional gendered lines.
Data and sources
Our first data set was obtained from a request through the UWaterloo Help Portal’s Student Systems Support. It includes demographic information from all students enrolled in the Faculty of Math in every fall term from Fall 2019 to Fall 2024. This includes students on co-op, enrolled in classes, or on an off-term, as long as they remained within the Faculty of Math and did not transfer to another faculty or leave the University of Waterloo. We received the following data:
Graduate Students
| Term Description | Fall 2019 | Fall 2020 | Fall 2021 | Fall 2022 | Fall 2023 | Fall 2024 |
|---|---|---|---|---|---|---|
| Woman | 34% | 33% | 32% | 33% | 34% | 31% |
| Man | 63% | 62% | 62% | 62% | 63% | 66% |
| Another Identity | -- | -- | ≤10 | ≤10 | ≤10 | ≤10 |
| Not Reported | 3% | 4% | 5% | 5% | 3z% | 2% |
Undergraduate Students
| Term Description | Fall 2019 | Fall 2020 | Fall 2021 | Fall 2022 | Fall 2023 | Fall 2024 |
|---|---|---|---|---|---|---|
| Woman | 36% | 35% | 35% | 34% | 33% | 32% |
| Man | 62% | 64% | 64% | 65% | 66% | 67% |
| Another Identity | ≤30 | ≤30 | ≤30 | ≤30 | ≤30 | ≤30 |
| Not Reported | 1% | 1% | 1% | 1% | 1% | 1% |
Note: Response counts less than or equal to 10 for the Graduate Students graph, and less than or equal to 30 for the Undergraduate Students graph, are suppressed to maintain respondent confidentiality, and because percentages in these cells rounded to 0%. "--" indicates there is no data for this cell.
We collected the second data set from the University of Waterloo Equity Survey responses, based on voluntary employee answers in Workday from September 2023 through May 2024 with a response rate of 43% in the Faculty of Math academic employees, 51% in the Faculty of Math overall, and 59% in the University of Waterloo overall. We obtained this through contacting the University of Waterloo's Institutional Analysis and Planning group. We received the following data:
| Employee Description | Faculty of Mathematics academic employees |
Faculty of Mathematics overall | UWaterloo overall |
|---|---|---|---|
| Woman | 24% | 39% | 59% |
| Man | 65% | 52% | 35% |
| Another Identity | 5% | 4% | 3% |
| Not Reported | 10% | 7% | 5% |
Note: for both data sets, "Another Identity" includes Agender, Another gender identity, Gender non-conforming, Non-binary, Questioning, Trans, Two-Spirit.