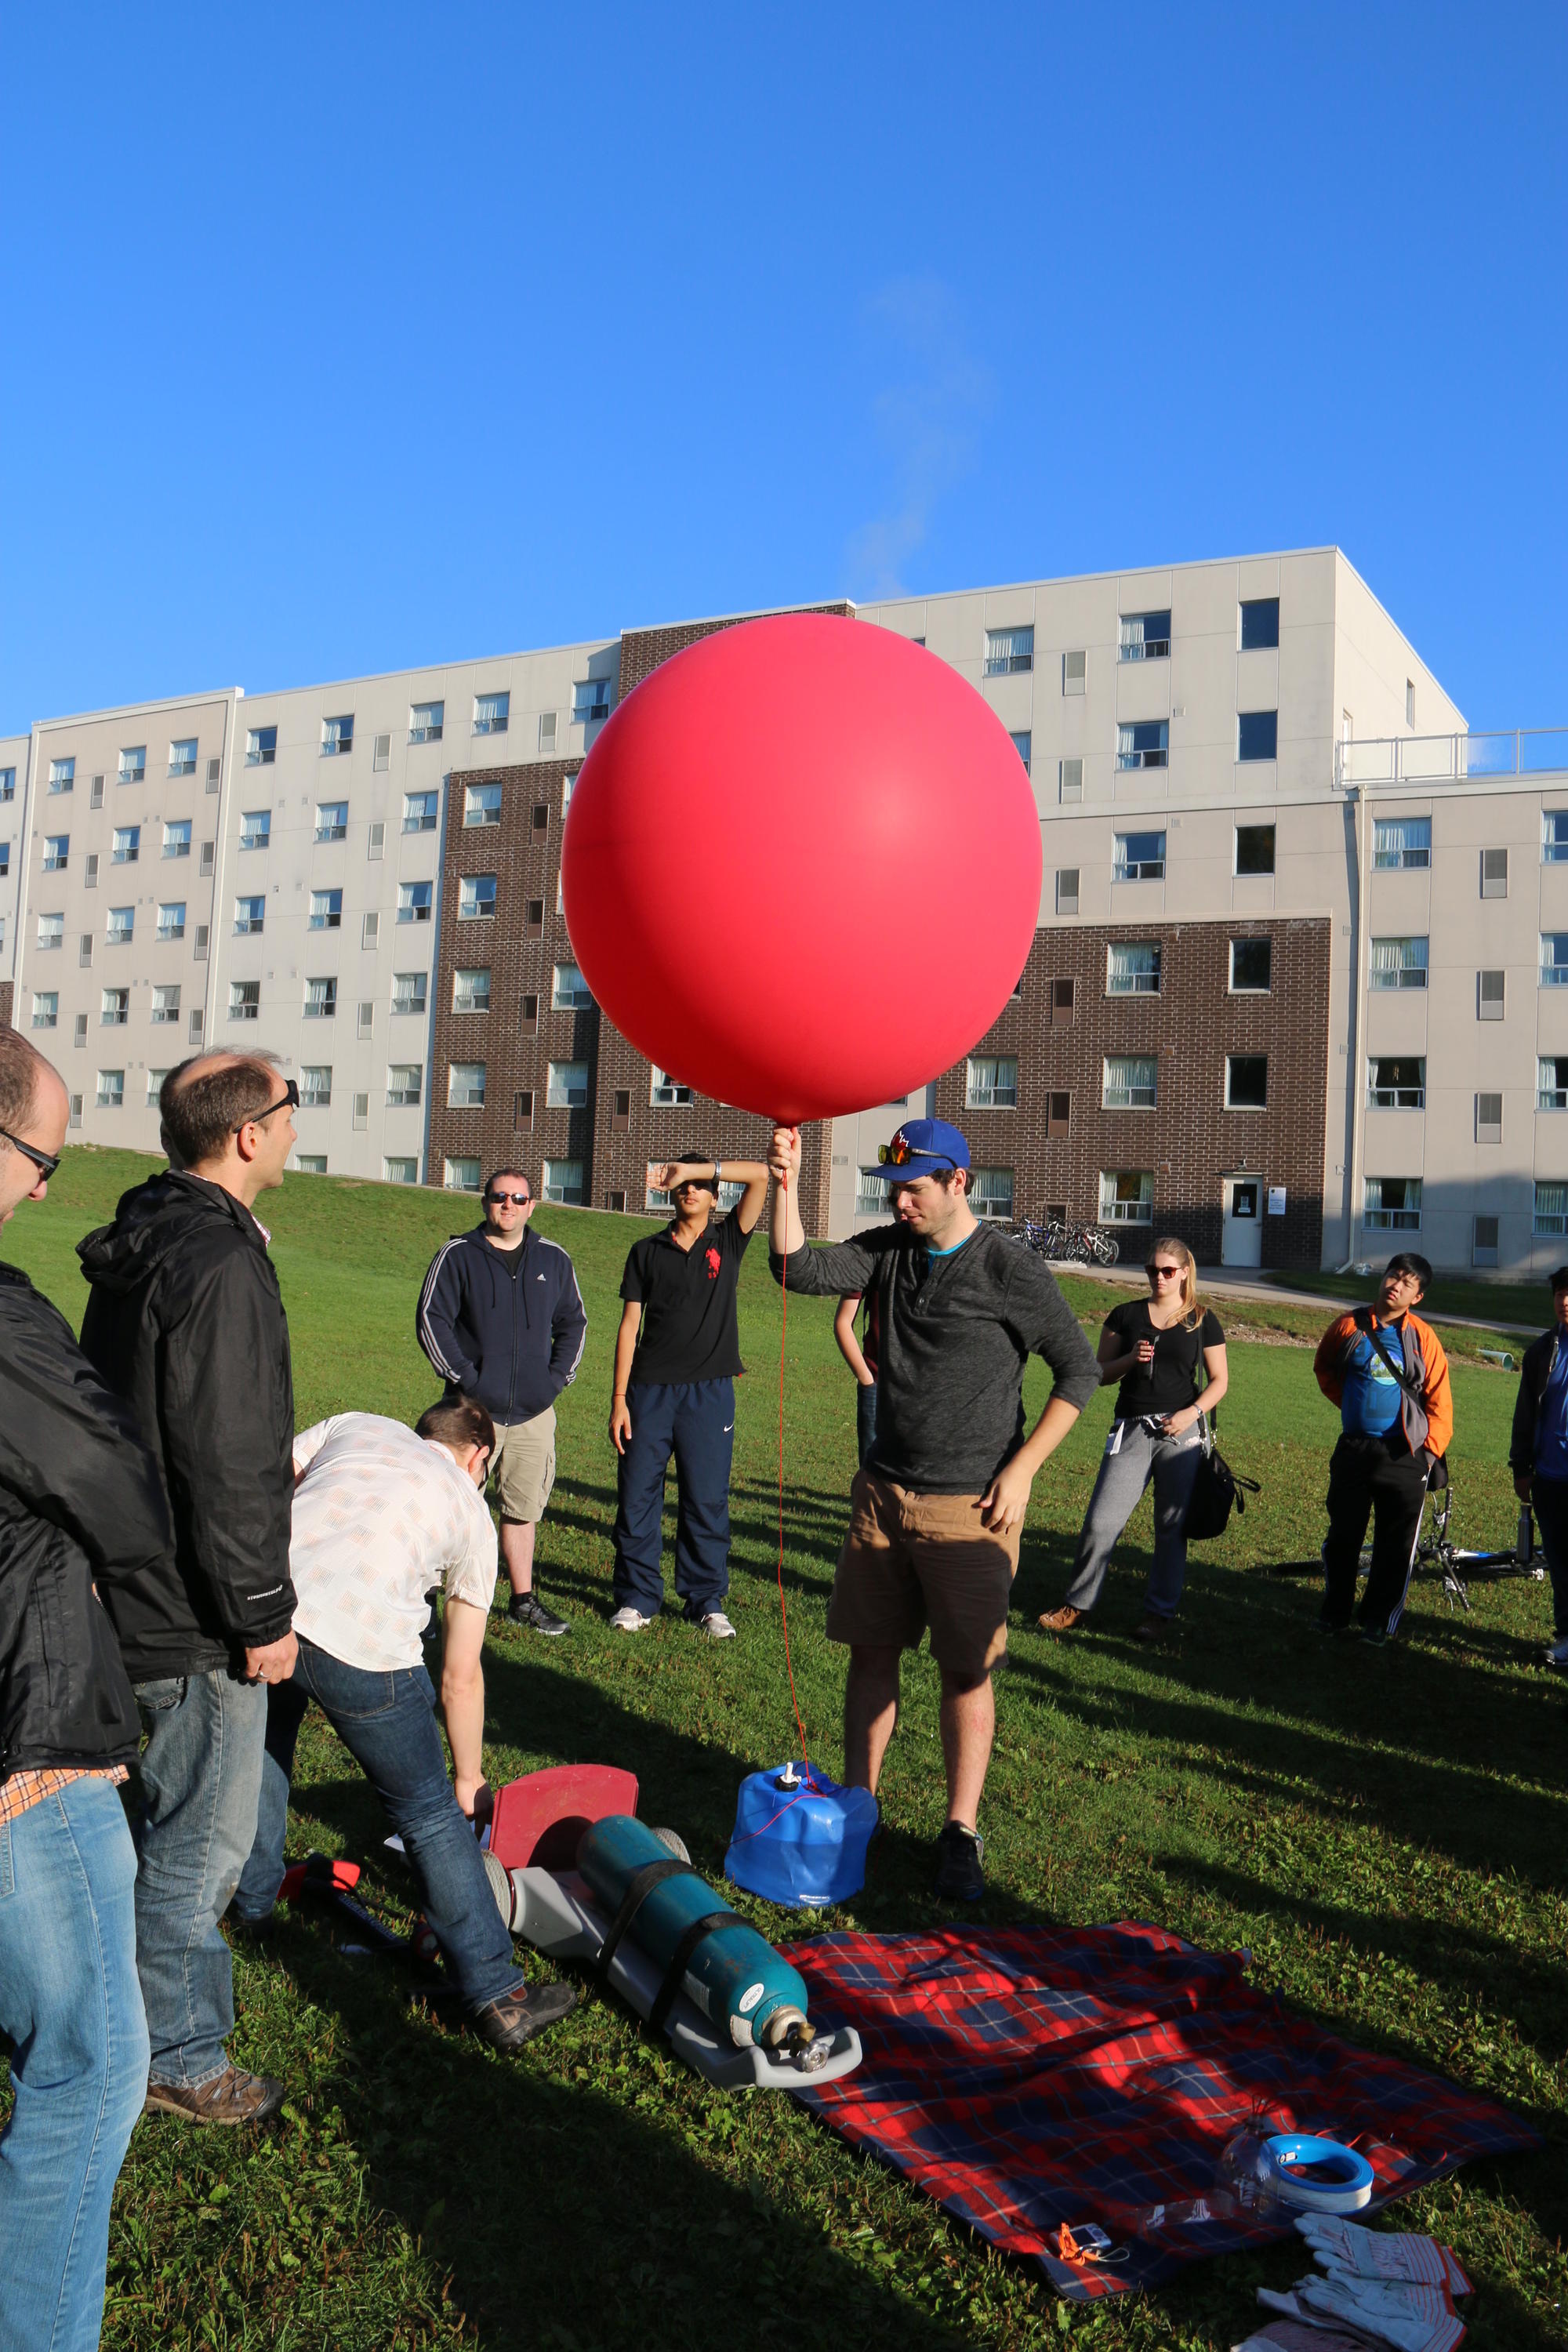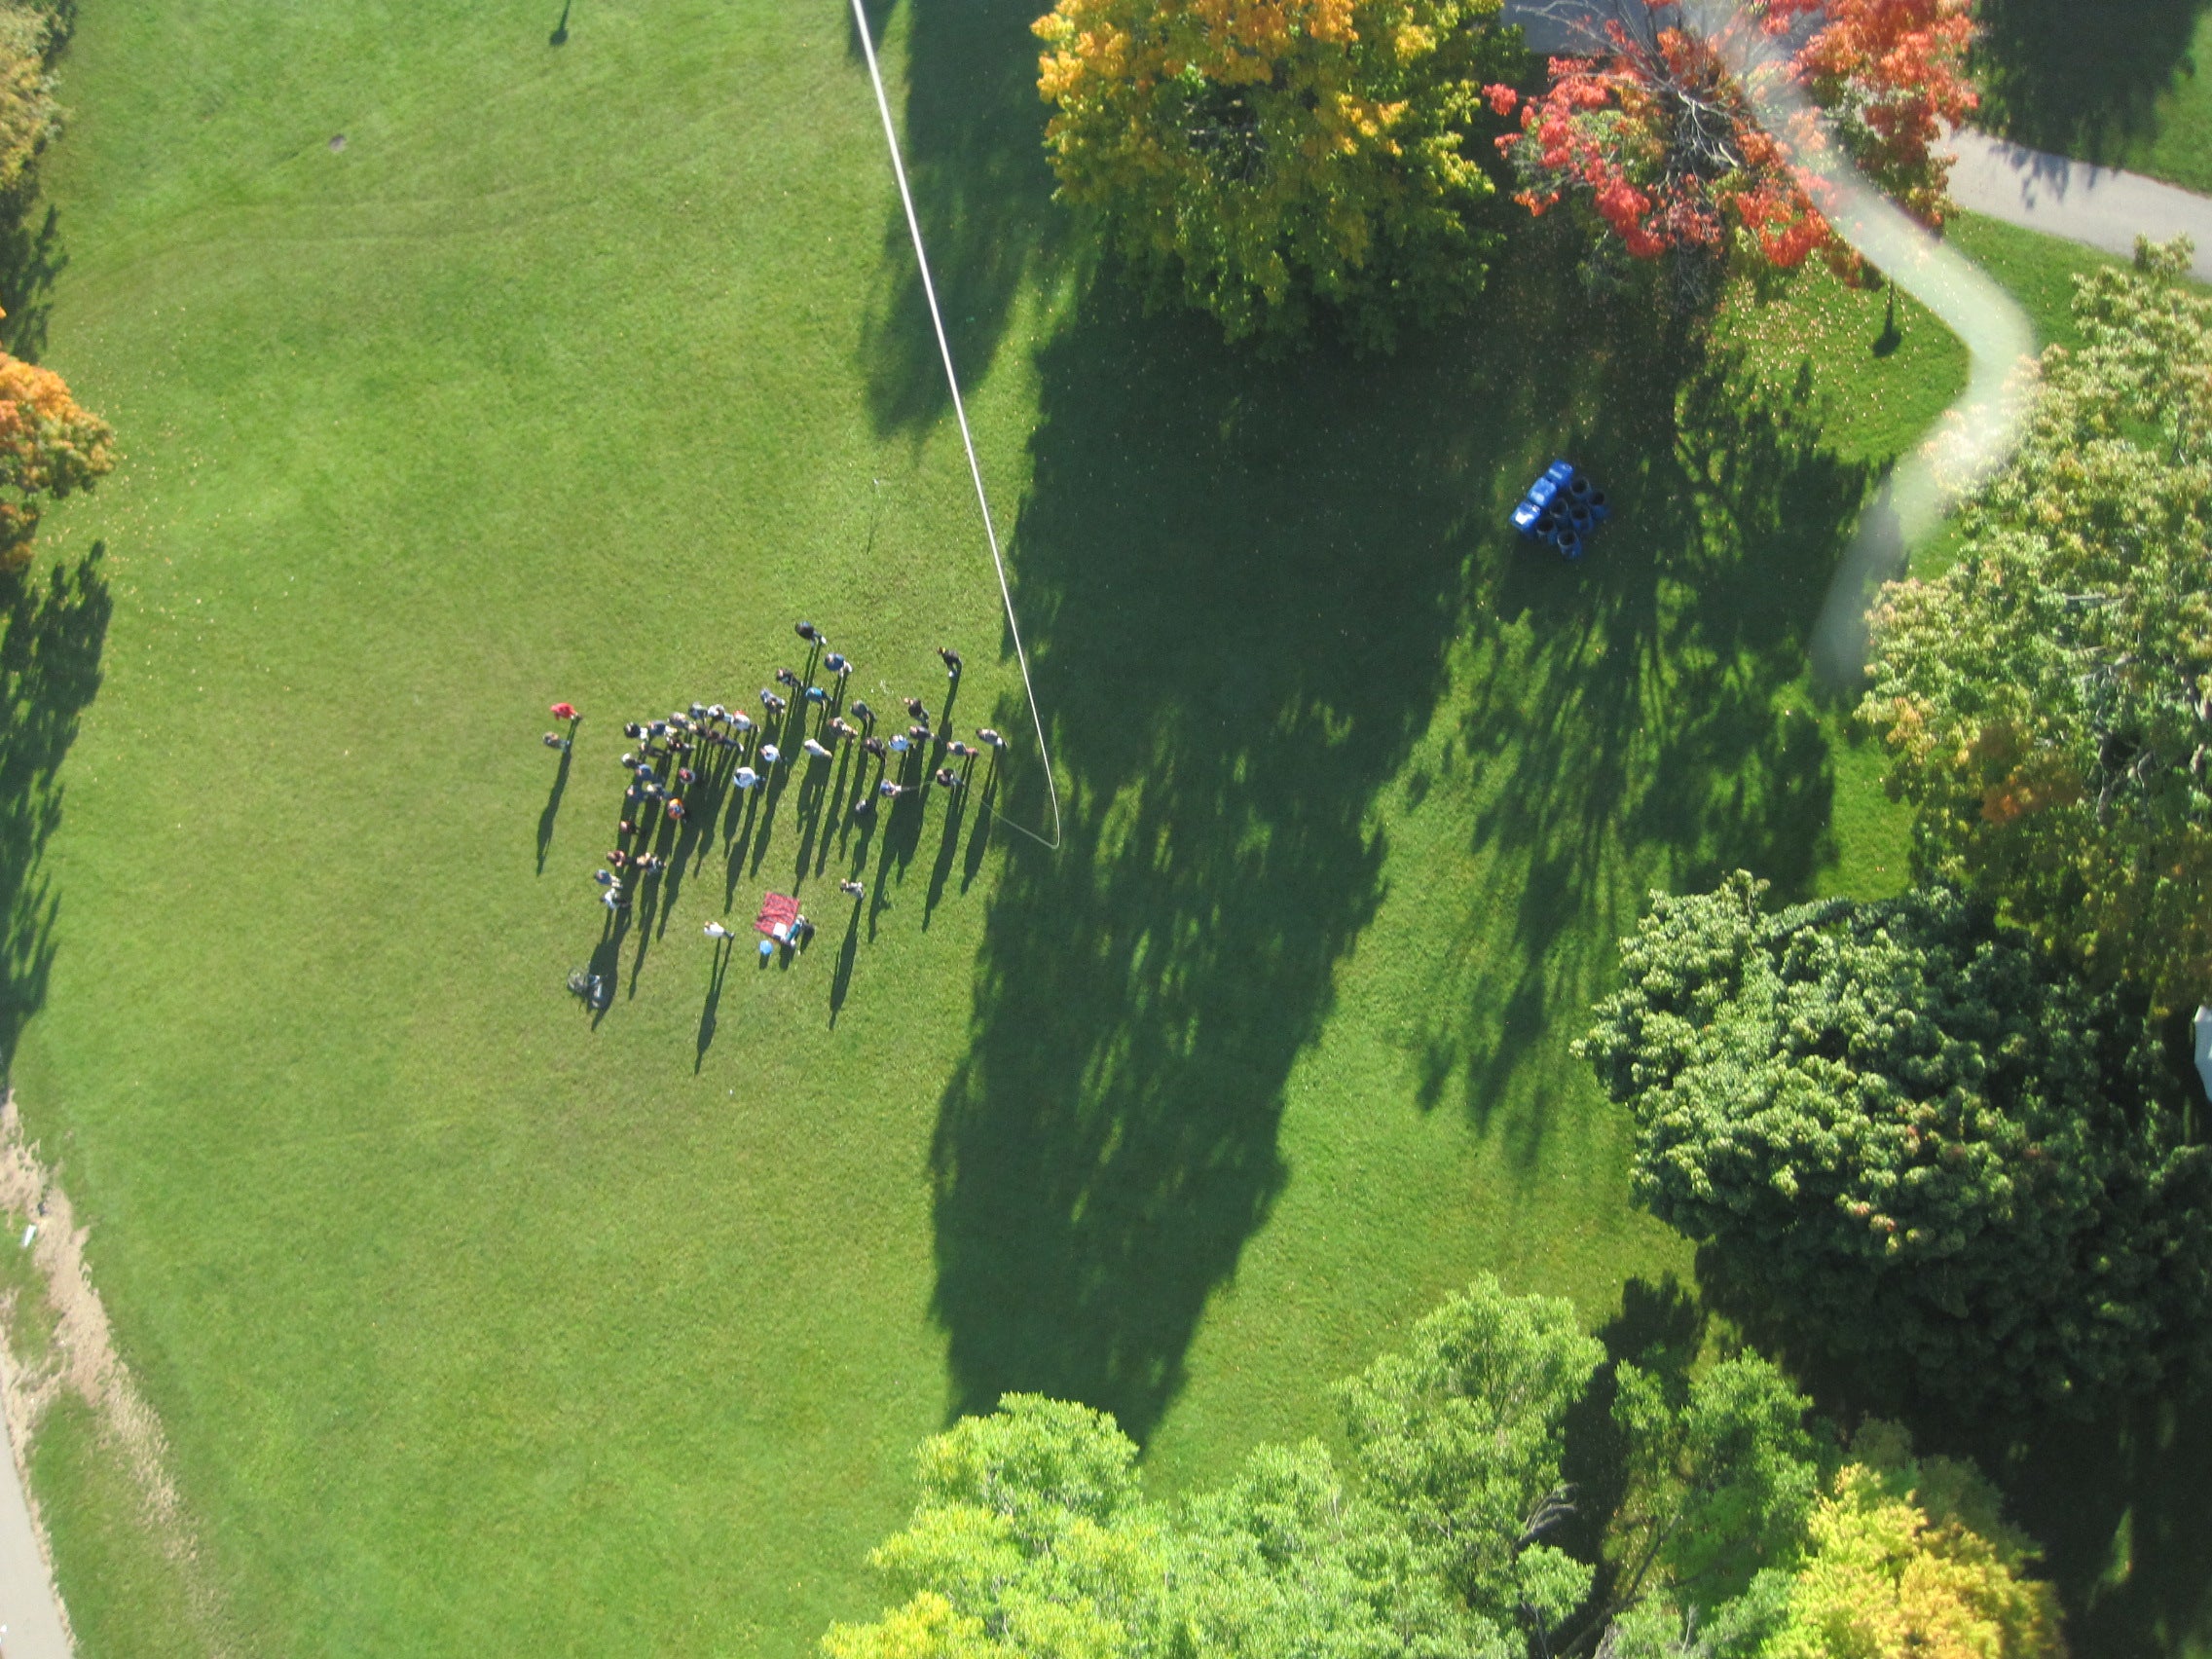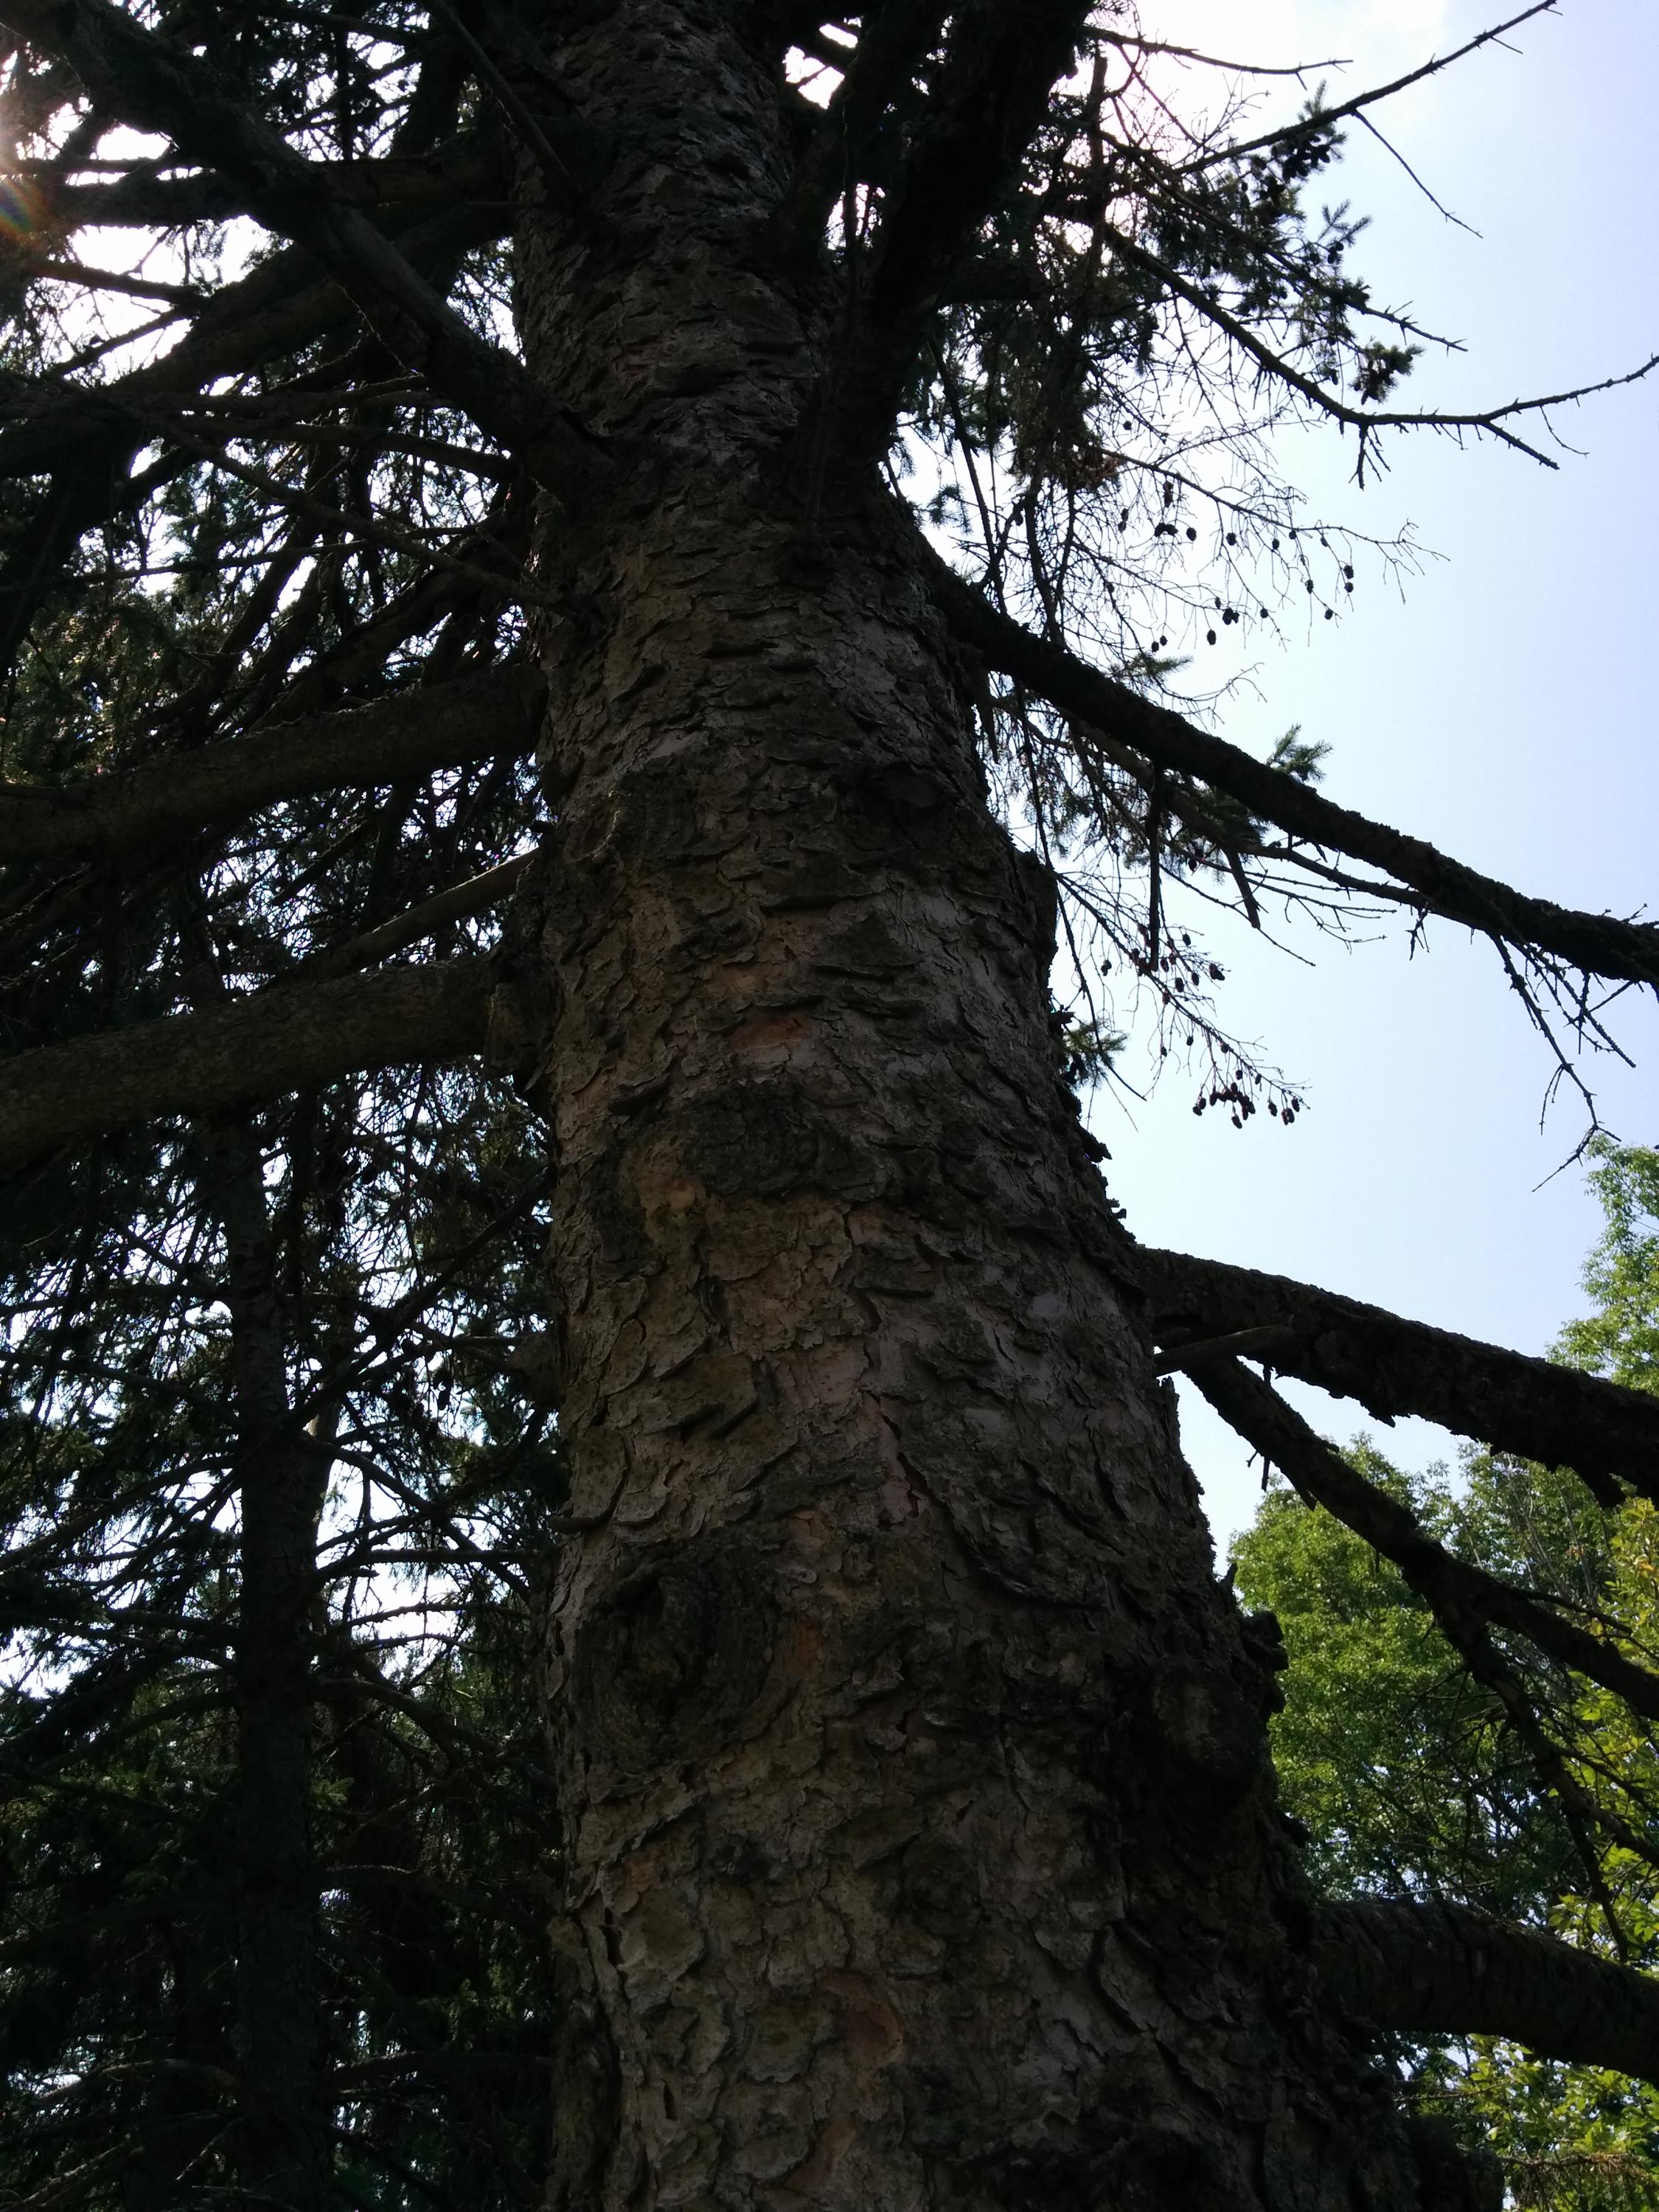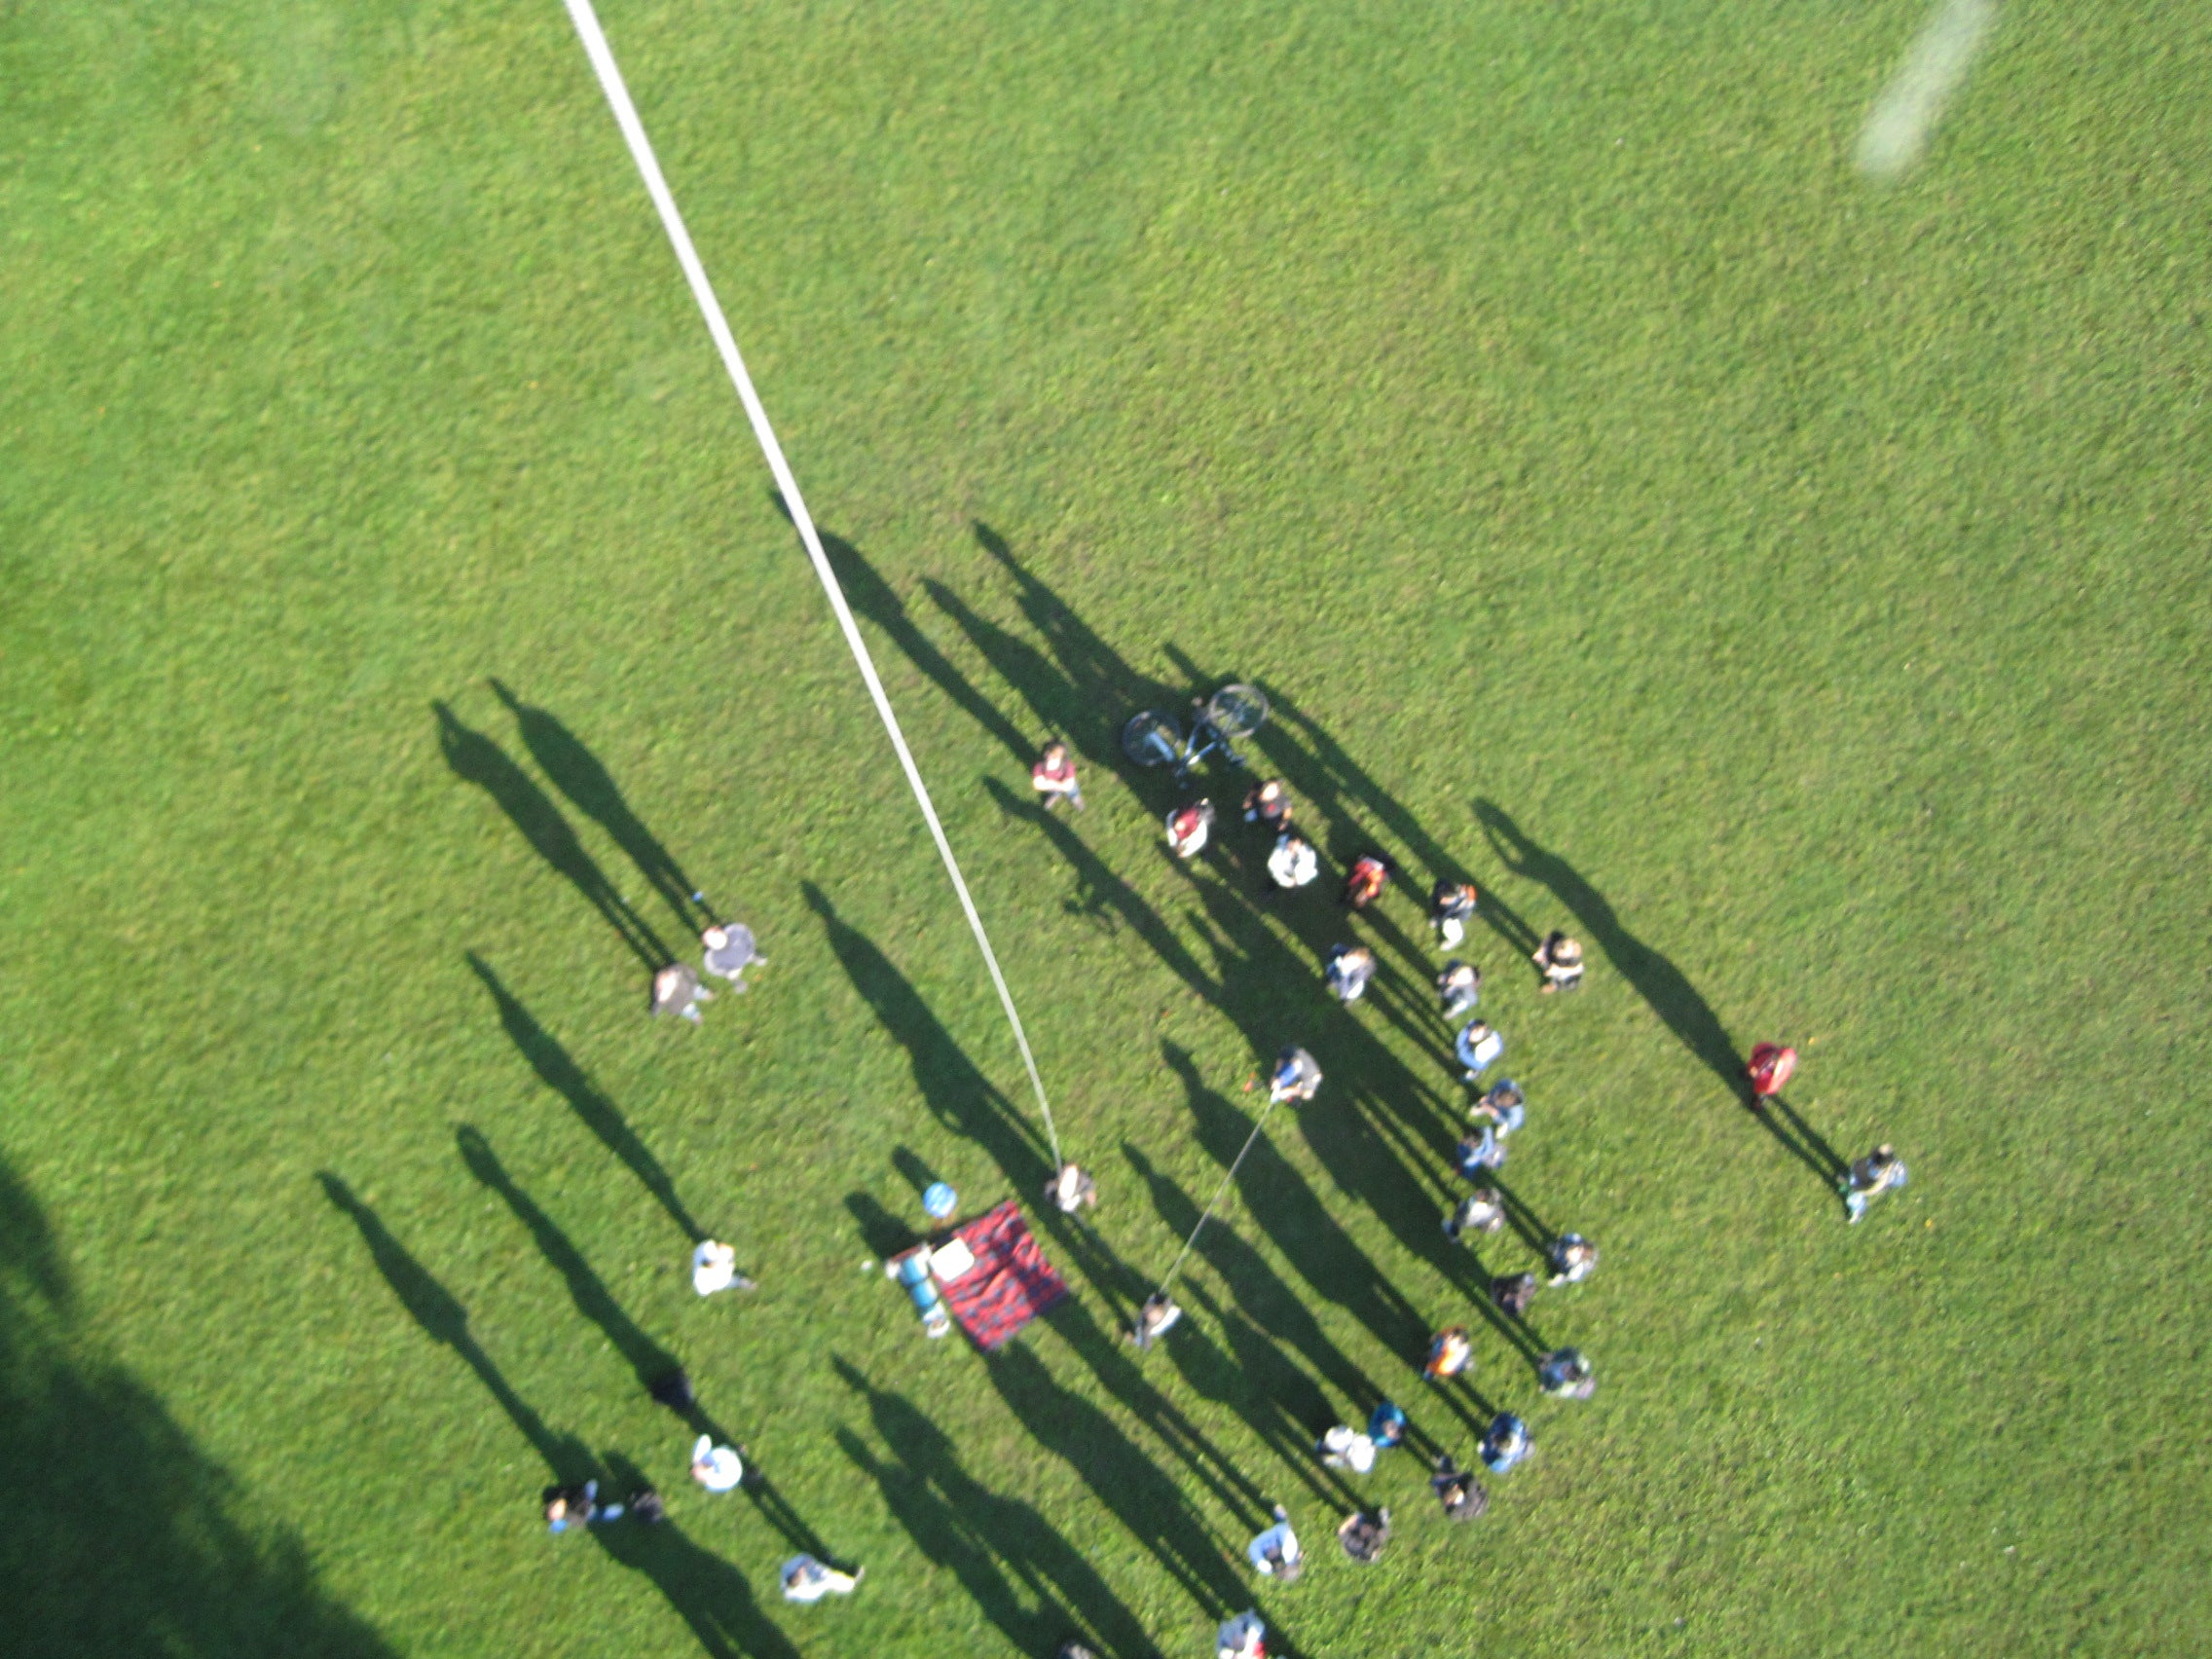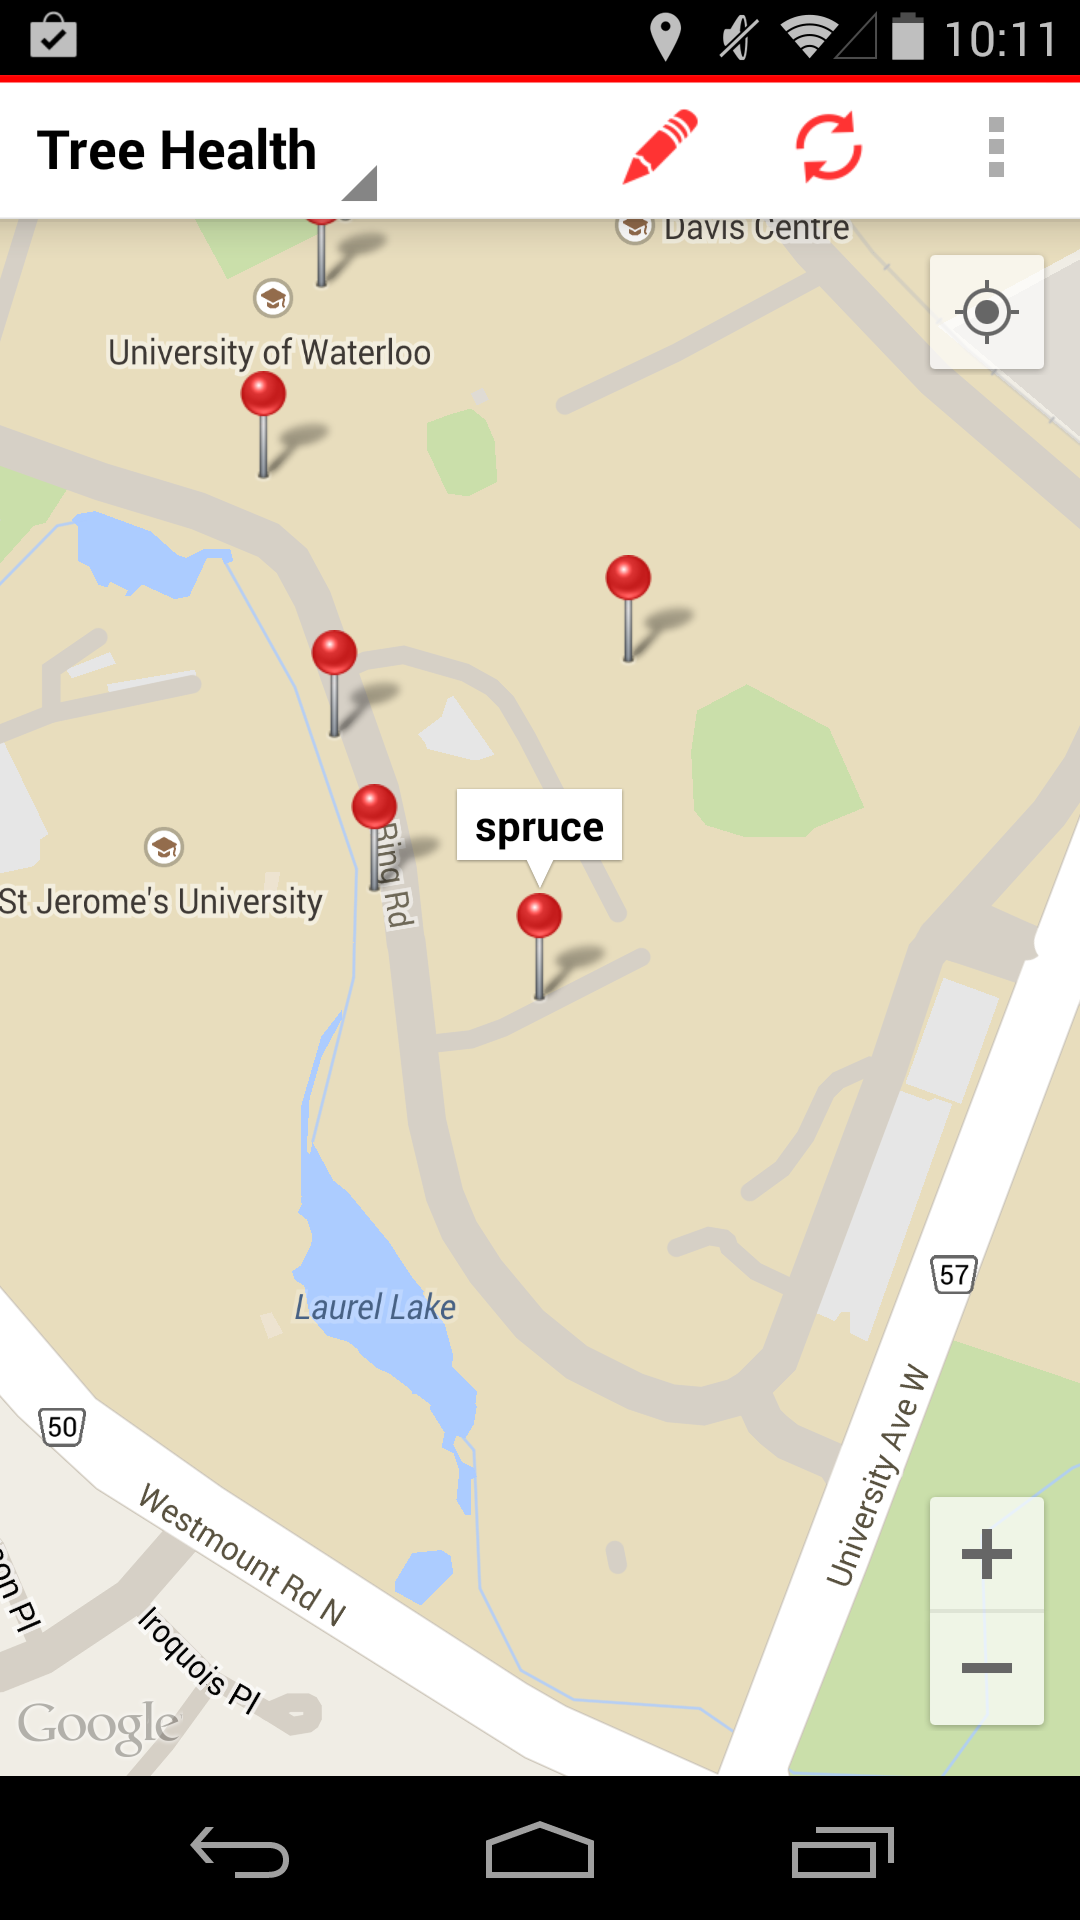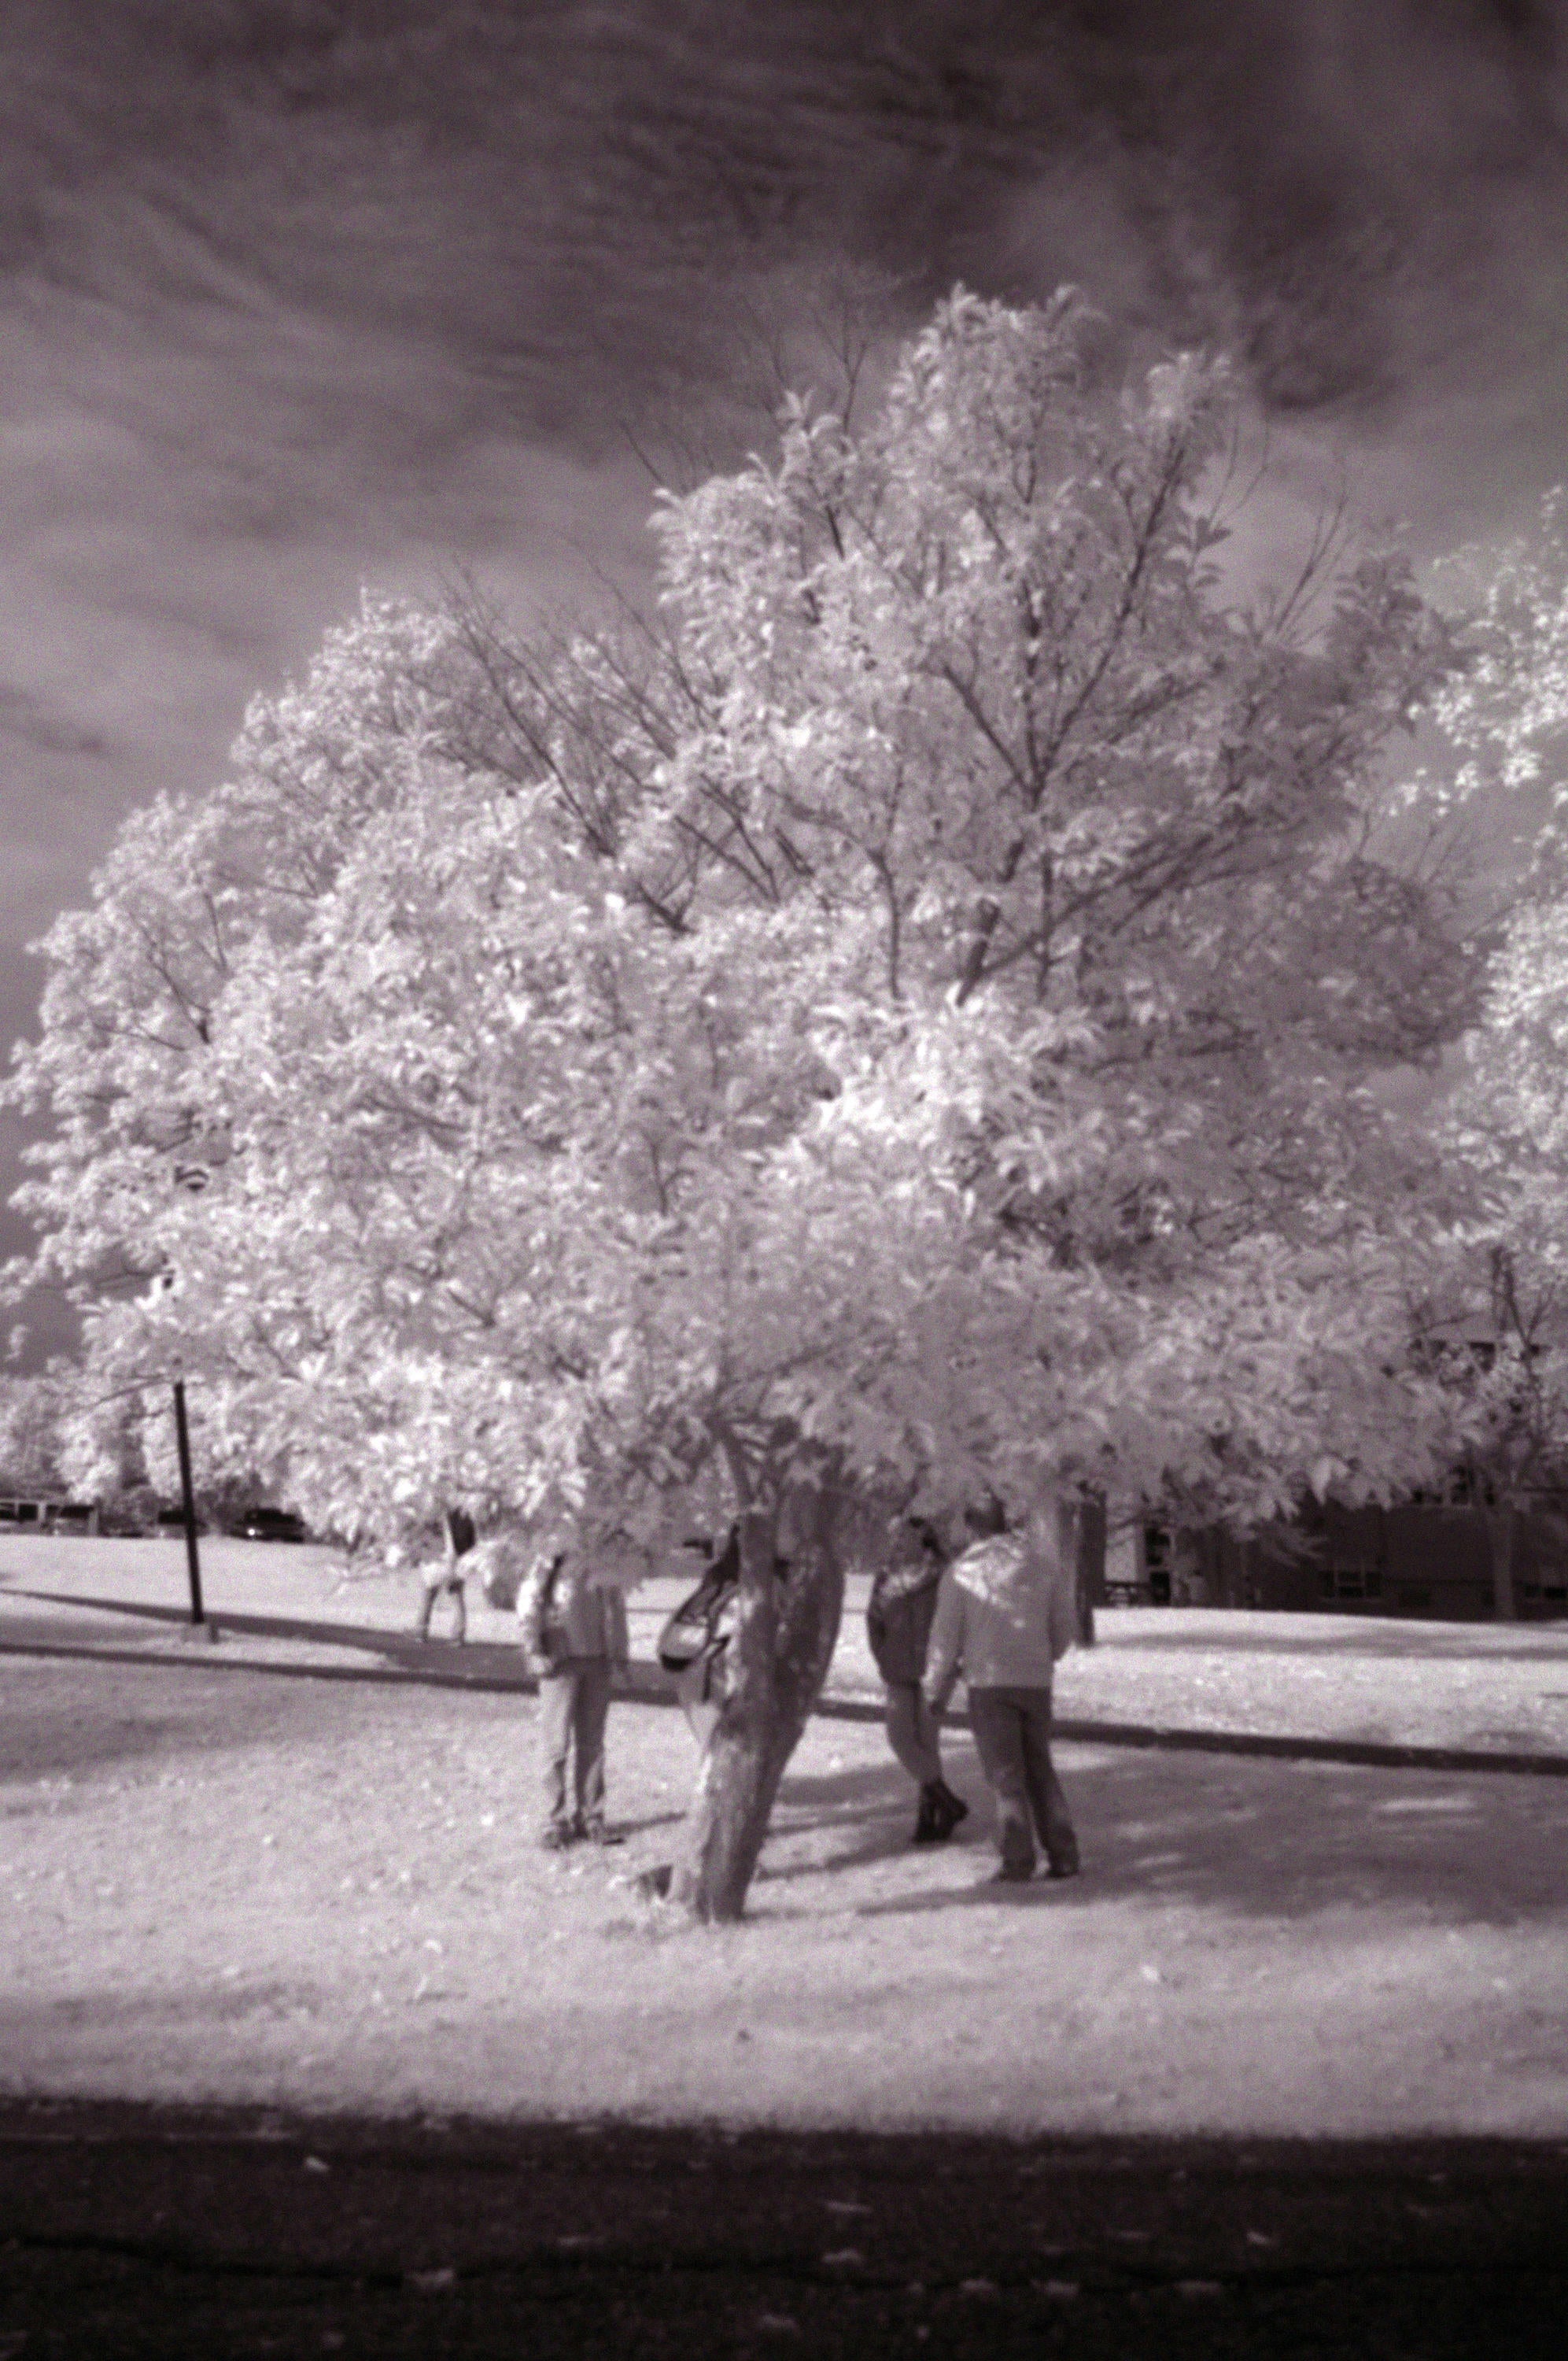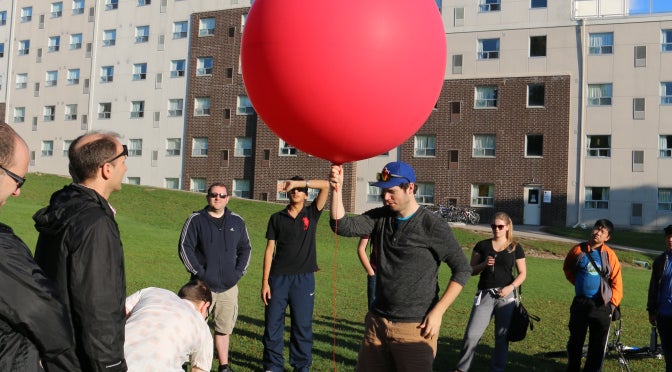
I’m currently leading a research project that looks to compare two first-year Geomatics courses (GEOG 181 and the new GEOG 187). Having instructed the prior version of GEOG 181, and now designing and instructing GEOG 187, I’m trying to understand what the impact is of ‘experiential’ teaching methods on student engagement with traditionally tricky concepts, called ‘threshold concepts’. In particular, I’m interested in how students engage with the fundamental geographic concept of ‘scale’. When I talk about scale, I mean how different objects can be represented differently at various scales (local to global), and how geographers and cartographers manipulate and change how objects are visualized to communication information. This work is supported by the University of Waterloo Centre for Teaching Excellence LITE (Learning Innovation and Teaching Enhancement) Full Grant. You can read a nice writeup of the project. This research is currently underway, with data collection from two first year classes complete, and basic analysis commencing soon. I’m hoping to have some general summaries completed by next semester and look forwards to sharing the results with the broader UWaterloo community of teaching practice. In the meantime, here are a few photos of GEOG 187 and their ‘experiential’ data collection this past fall.