Blog

Filter by:

Limit to posts where the date of the blog post:
Date range
Limit to posts where the date of the blog post:
Limit to posts where the title matches:
Limit to posts tagged with one or more of:
Limit to posts where the audience is one or more of:
Tuesday, April 23, 2013

Tweet-mapping American TV ratings

This past winter semester I launched a new course at the University of Waterloo called "The Geoweb and Location-Based Services (PDF)". This 4th-year course introduced senior undergraduate students to the theoretical concepts and practical techniques of Web 2.0, Volunteered Geographic Information, Open Data, the Geoweb, and location-based services using mobile phones.
We all know that climate change is having a major impact on weather patterns around the globe. One industry that is particularly exposed to these changes is the ski industry. Though large mountain/high elevation ski resorts may remain insulated from the impacts of shorter ski seasons and more erratic weather, those ski resorts at low altitude are particularly vulnerable to a changing climate. As a mid-latitude, lower elevation (comparatively) ski region, the Pyrenees are one area where the impacts of a changing climate are pronounced.

A chapter from my dissertation has been recently published in Environment and Planning B: Planning and Design. This paper, titled “Negotiating constraints to the adoption of agent-based modeling in tourism planning (PDF)” presents material from a series of interviews that I conducted with tourism planners in Nova Scotia.

As part of the project “Geoweb and Community Development in Quebec“, two teams of McGill School of the Environment students spent the fall term 2010 working with a community-based watershed monitoring agency CDRN (Corporation de développement de la rivière Noire) to explore the potential for the Geoweb to serve as a conduit for citizen participation in watershed management. These student groups developed two tools, conducted a series of workshops with community members, and produced reports and instructional materials.

Tuesday, March 11, 2008

Baddeck Hotel Development results

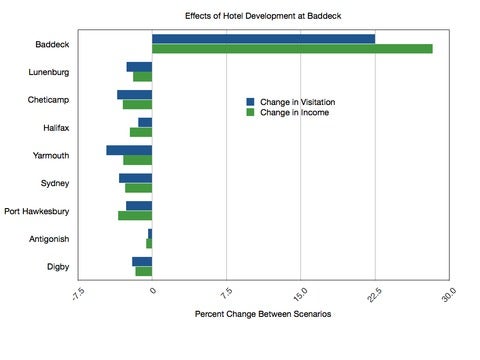
I’ve been putting together some sample results using the Baddeck Hotel Development scenario. I ran the model with the default range of accommodations, and then re-ran it with the “Add Hotel at Baddeck” button selected. You can experiment with this same scenario under the Tourism Scenarios tab. Below I’ve added a chart that shows the percentage change in tourist visitation per day (blue bar) and percentage change in income per day (green bar) at select destinations. This shows the difference between the base scenario and the add hotel scenario.