Analysis of fish impingement at the Pickering nuclear station
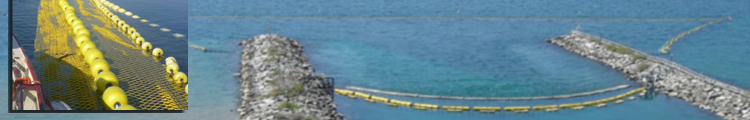
The primary objective of this study was to estimate the reliability of the fish diversion structure (FDS) (i.e., barrier netting) in reducing the total biomass (i.e., fish) impinged at the Pickering Nuclear Station. Because of uncertainties in measurement and data collection, the exact amount of total biomass impinged at the station is unknown. As a result, we developed a probabilistic approach to estimate the total impingement at the station.
Data analysis
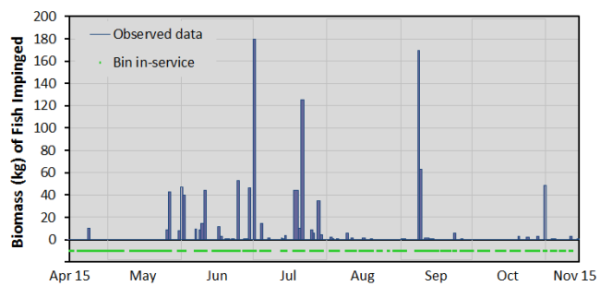
The cooling water entering the station passes through various bar and travelling screens. The biomass (i.e., fish) captured at each screen location is collected into large bins. The bins are sampled periodically for species type and weight. The collection or sampling is generally bi-weekly or multiple times a week for a period of 24 hours (shorter and longer times also occur - up to many days). In general, the collection bins were in-service for approximately 50 % of the time.
The data are highly variable and skewed, with many sampling periods with zero biomass vs.
some with 1000's of fish. As a result, the data are not amenable to standard time-series type models.
Probabilistic methodology
Probability distributions were fitted to the observed biomass data from each sampling period. The occurrence of zero impingement on any given day was modelled using the Binomial distribution, while the highly skewed non-zero observations of daily impingement were fitted using the Weibull distribution. The distribution of total biomass collected for each bin during each season (Summer and Winter) was estimated using Monte Carlo Simulation.
Results
-
The fish diversion structure (FDS) was able to achieve > 80 % reduction in fish impingement with high probability (between the reference year and the initial year of deployment)

- Work is continuing to assess the sampling results from subsequent years of deployment
- This includes assessing the impact of sampling frequency on the results