This won the best paper award!
Background/Context: During the Winter season, real-time monitoring of road surface conditions is critical for the safety of drivers and road maintenance operations. Previous research has evaluated the potential of image classification methods for detecting road snow coverage by processing images from roadside cameras installed in RWIS (Road Weather Information System) stations. However, it is a challenging task due to limitations such as image resolution, camera angle, and illumination. Two common approaches to improve the accuracy of image classification methods are: adding more input features to the model and increasing the number of samples in the training dataset. Additional input features can be weather variables and more sample images can be added by including other roadside cameras. Although RWIS stations are equipped with both cameras and weather measurement instruments, they are only a subset of the total number of roadside cameras installed across transportation networks, most of which do not have weather measurement instruments. Thus, improvements in use of image data could benefit from additional data sources.
Aims/Objectives: The first objective of this study is to complete an exploratory data analysis over three data sources in Ontario: RWIS stations, all the other MTO (Ministry of Transportation of Ontario) roadside cameras, and Environment Canada weather stations. The second objective is to determine the feasibility of integrating these three datasets into a more extensive and richer dataset with weather variables as additional features and other MTO roadside cameras as additional sources of images.
Methods/Targets: First, we quantify the advantage of adding other MTO roadside cameras using spatial statistics, the number of monitored roads, and the coverage of ecoregions with different climate regimes. We then analyze experimental variograms from the literature and determine the feasibility of using Environment Canada stations and RWIS stations to interpolate weather variables for all the other MTO roadside cameras without weather instruments.
Results/Activities: By adding all other MTO cameras as image data sources, the total number of cameras in the dataset increases from 139 to 578 across Ontario. The average distance to the nearest camera decreases from 38.4km to 9.4km, and the number of monitored roads increases approximately four times. Additionally, six times more cameras are available in the four most populated ecoregions in Ontario. The experimental variograms show that it is feasible to interpolate weather variables with reasonable accuracy. Moreover, observations in the three datasets are collected with similar frequency, which facilitates our data integration approach.
Discussion/Deliverables: Integrating these three datasets is feasible and can benefit the design and development of automated image classification methods for monitoring road snow coverage. We do not consider data from pavement-embedded sensors, an additional line of research may explore the integration of this data. Our approach can provide actionable insights which can be used to more selectively perform manual patrolling to better identify road surface conditions.
Conclusions: Our initial results are promising and demonstrate that additional, image only datasets can be added to road monitoring data by using existing multimodal sensors as ground truth, which will lead to greater performance on the future image classification tasks.
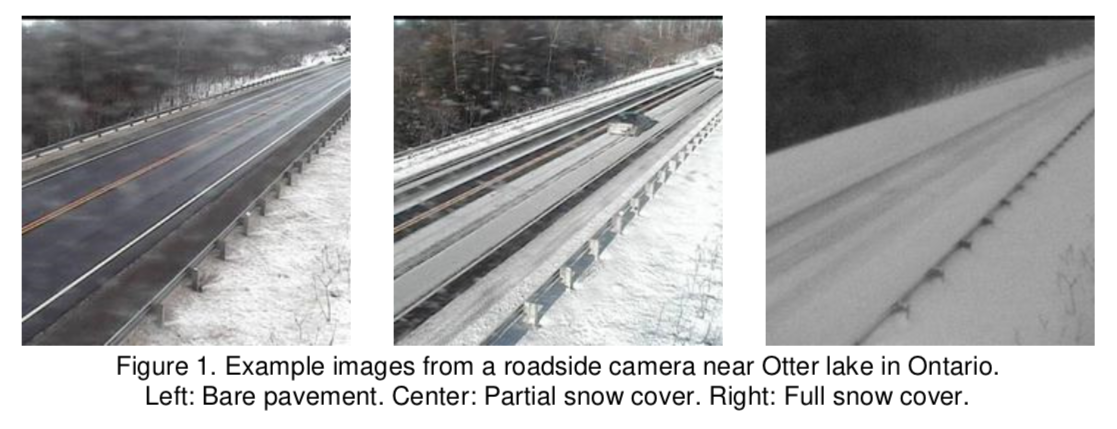
 Road maintenance during the Winter season is a safety critical and resource demanding operation. One of its key activities is determining road surface condition (RSC) in order to prioritize roads and allocate cleaning efforts such as plowing or salting. Two conventional approaches for determining RSC are: visual examination of roadside camera images by trained personnel and patrolling the roads to perform on-site inspections. However, with more than 500 cameras collecting images across Ontario, visual examination becomes a resource-intensive activity, difficult to scale especially during periods of snowstorms. This paper presents the results of a study focused on improving the efficiency of road maintenance operations. We use multiple Deep Learning models to automatically determine RSC from roadside camera images and weather variables, extending previous research where similar methods have been used to deal with the problem. The dataset we use was collected during the 2017-2018 Winter season from 40 stations connected to the Ontario Road Weather Information System (RWIS), it includes 14.000 labeled images and 70.000 weather measurements. We train and evaluate the performance of seven state-of-the-art models from the Computer Vision literature, including the recent DenseNet, NASNet, and MobileNet. Also, by integrating observations from weather variables, the models are able to better ascertain RSC under poor visibility conditions.
