Download your own paper sundial, plus other plots! You can custom-design plots for various uses, and set orbital parameters for other planets etc. No astronomy or math skills needed.
Download the paper sundial PDF
General overview and background
This project stems from a long-standing interest in astronomy, especially obtaining a better intuitive understanding of simple phenomena, such as the movement of the earth around the sun. It turns out, however, that the problem of generating a sundial is somewhat more complicated, and much more subtle, than I initially thought.
In particular, although it is "obvious" that the earth takes a year to go around the sun, and 24 hours to turn on its axis, how do we make this more precise in order to write a computer program to simulate it?
Well, in fact it does NOT take 24 hours for the earth to turn on its axis; it's just that, on average, it takes 24 hours for the sun to show up between one morning and the next. It is also tempting to suppose that at noon the sun is at its peak, and on the other side of the earth at midnight, however the earth's rotational axis is tilted, so notions of "peak" and "other side" do not define well either.
However these notions ARE well defined at the summer solstice (when the earth's northern axis is pointed towards the sun). So the ONLY assumptions which we need are the following:
- At noon on the summer solstice, the sun is at its peak.
- It takes one year to complete a full orbit.
- There are 365 days in one year.
That's all one needs to assume! If one starts making any more assertions than that, then you'll run into problems or contradictions.
Using the sundial
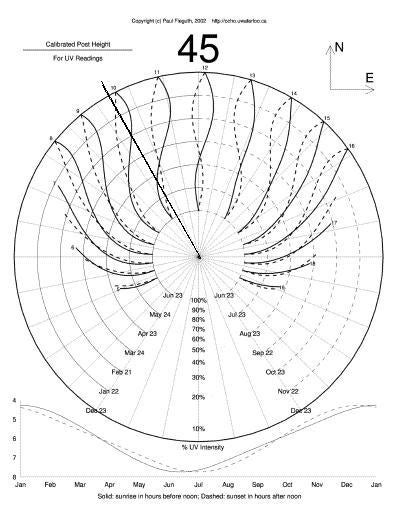
The image at right is the main sundial page; it needs to be laid flat, oriented north (see arrow in upper right corner) and with a small wire or stick in the middle to cast a shadow.
The solid lines in the image correspond to winter/spring; the dashed ones to summer/fall. Each pair of lines corresponds to a particular hour (in this plot, the hours from 5 through 19).
To read the time, determine whether solid or dashed lines apply, based on today's date. Then, based on the date, find the appropriate radius from which to read. The position of the shadow, at that radius, determines the time. For example, for the shadow sketched in the image,
- If the date is April 23, then the time is about 10:55a.m.
- If the date is January 22, then the time is about 9:50a.m.
- If the date is September 10, then the time is about 10:45a.m.
Note the characteristic "figure-eight" shape, known as an analemma (also referred to as the "equation of time") taken on by the sun over a period of a year (most obvious if you look at the curves for 12 noon). It is a common misconception that the analemma is due to the non-circular nature of the earth's orbit; this is not currect - generating the sundial for a perfectly circular orbit still produces a clear figure eight.
The dashed lines in the bottom half of the circle show approximate relative ultraviolet (UV) levels. This works only if the central wire or stick has the length indicated in the upper left corner. The radius of the shadow shows the relative UV level (relative to 100%, the peak summer level) at any time.
The plot at the bottom of the page shows sunrise and sunset times. Note the interesting offsets/shifts between the two curves.
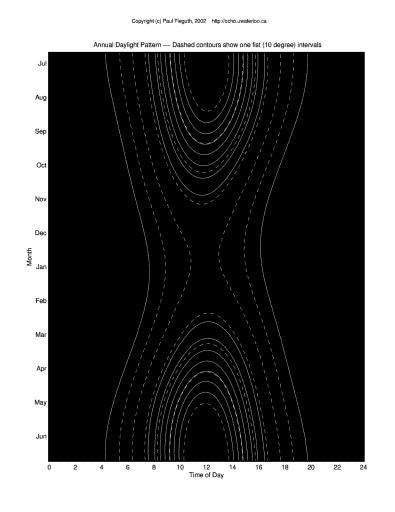
The second image shows the standard "hourglass" plot (the "hourglass" term shows a northern bias; in the arctic, equatorial, and southern latitudes the plot looks quite different, and not like an hourglass at all).
The plot shows basically the same information as the previous figure, but laid out very differently. The time of day goes horizontally; the date vertically. The outermost solid curves show the times of sunrise and sunset. The dashed lines show 10-degree contours for the angular height of the sun above the horizon. Since 10 degrees is approximately the size of your fist, held at arm's length, you can tell time from this plot too:
- If the date is August 15th, and the sun is two fists above the horizon, then the time is either 7a.m. or 6p.m.
- If the date is December 15th, and the sun is one fist above the horizon, then the time is either 8a.m. or 3:30p.m.
The inner solid lines show UVI contours, starting from one. In the customization section on the main page, this plot can be customized in a variety of ways.
Parameter definitions
There are a number of parameters which are available to the user, on the main page. I'll discuss them in the same order as they appear:
| Your latitude: | Your latitude, in degrees; give a positive value for north, a negative one for south. |
|---|---|
| Long. offset: | Time zones can be pretty wide, and the time is constant over the entire zone, even though the sun will appear to be in different positions for people in different parts of the time zone. In order to generate a sundial for your nominal, local time, we need to correct for the time difference determined by your longitude. This needs an automated list ... |
| Radial distance: | The radial distance on the plot can be generated in one of three ways:
|
| Orbital parameters: | A detailed discussion of these goes a bit beyond the scope of this little writeup. For most users, the nine defaults provided by the buttons, one for each planet, will be more than enough. Briefly,
|