
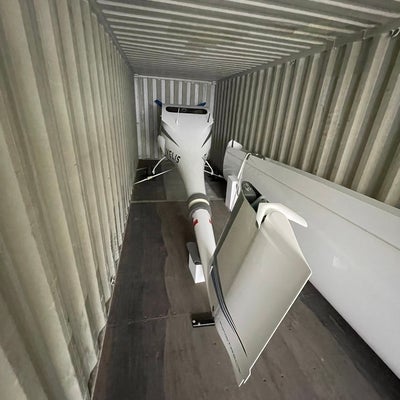
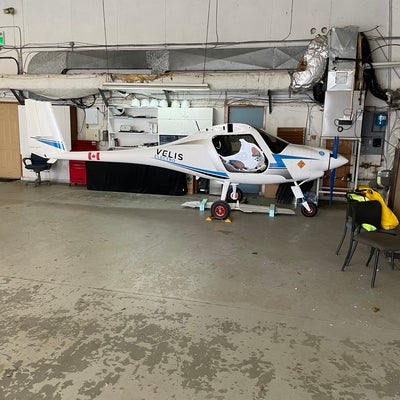
The electric plane fleet expanded across the country in 2024. Canada’s first Pipistrel Velis Electro was flown by Waterloo Institute for Sustainable Aeronautics (WISA) researchers and Waterloo Wellington Flight Centre (WWFC) personnel in 2023. Waterloo has added a second Velis Electro for 2024 (with financial support from the Federal Economic Development Agency for Southern Ontario) and a third Velis Electro was purchased by Sealand Aviation on Vancouver Island (with financial support from Clean BC).
WISA researchers have partnered with WWFC and Sealand Aviation to generate and analyse flight data and share results with Transport Canada. A key question is how do electric planes perform in these very different parts of the country? The first flights are compared and shared here.


The first flights of each aircraft are compared to see if initial battery performance is similar. The SOC, or state of charge, represents how much energy remains in the battery. A fully charged battery starts with 100% SOC. If you land with the recommended minimum of 30%SOC remaining in the battery (effectively keeping 30% in reserve in case of emergency), do you have similar flights times?

Graph 1 compares the first three flights of the Velis Electro on Vancouver Island with the first three flights of the Velis Electro at Waterloo. The take off time is set to zero on the graph. The initial SOC is nearly 100% and only changes slowly when the e-plane is doing its checks and taxiing on the ground prior to take off. At time = 0, the SOC declines steeply as the plane uses almost full power to climb to the desired altitude. When cruising at a steady altitude, the power consumption is typically less than half that of full climb power, so the slope of the line is not as steep. Finally, when the power is reduced to descend, the SOC line is nearly flat.
Most of the flights followed a similar pattern with a steep decline for the climb, a gradual decline for cruise and a flat line when descending to land. The sequence of similar patterns shows that a series of circuits (practicing take offs and landings) were being flown in most initial flights. The exceptions are two Sealand flights: the 17 April flight climbed to a higher initial altitude and then cruised at a steady rate until it reduced power to descend and the line rejoined the other lines; the 24 April flight had a more gradual decline indicating that less power was used for a steady cruise or upper air exercises for 25 minutes before flying a practice circuit and then landing. The explanation for the slower decline in SOC is that it was a solo flight. With a baseline weight of just 420 kg, the difference in Velis energy use for one vs. two people is noticeable.
The Waterloo flights consisted of a series of circuits with the take off, cruise, land sequence. Overall, the similar pattern between the two aircraft is as expected for an aircraft, like the Velis, which has been ‘type certified’ in Europe and 30 other countries.
Type certification indicates that the aircraft are built to consistent quality and safety standards. Comparing the performance of two identical aircraft, operating in different parts of Canada helps generate valuable data and experience for Canadian decision makers.
As noted above, the slope of the decrease in SOC depends on the power setting selected by the pilot. A high power setting (pushing the power lever forward) causes a steeper decline in SOC. A lower power setting makes the decline in SOC more gradual (equivalent to lower fuel consumption). To examine performance across various power settings we can compare the rate of decline in SOC (%SOC/min) to the power (kW) selected by the pilot.

Graph 2 makes this comparison for the two aircraft, both with brand new batteries. The dots for each aircraft show a similar pattern and the lines of best fit have similar formulas. The slopes are 0.0718 and 0.074. For simplicity’s sake, we can approximate this to 0.073 %SOC/min/kW, meaning that increasing the power setting by 1 kW will increase the SOC consumption by about 0.073 %SOC/min. At 20 kW (economy cruise), the SOC consumption is about 1.9 %SOC/min, and at 25 kW, the SOC consumption is about 2.2 %SOC/min, so increasing the power setting from 20 kW to 25 kW consumes an extra 3% SOC every 10 minutes. At 35 kW (max. cruise), the SOC consumption is about 3 %SOC/min, so increasing the power setting from 20 kW consumes an extra 10% SOC every 10 minutes!
The overall pattern is similar, which represents consistent performance between the two aircraft and their batteries. Regardless as to whether you choose to fly in southern Ontario or Vancouver Island, the aircraft and battery systems generated similar flight times with similar energy use patterns. This answers an important question for pilots and passengers alike: will an electric plane perform consistently in two different parts of Canada? The first flights provide an initial answer: yes!
The consistency between the two aircraft is also a testament to Pipistrel’s manufacturing and quality control processes. Stay tuned to find out how GAUW performs as it accumulates more hours, and how it compares to our new aircraft!