June 3, 2016
Check out changes to Arctic sea and lake ice
Canada’s leading polar data collection has released two animations to help the public see the impact of our changing climate
Canada’s leading polar data collection has released two animations to help the public see the impact of our changing climate
Canada’s leading polar data collection, based at the University of Waterloo, has released two online animations to help the public see how our changing climate is shrinking polar ice in Canada.
The animations - one for sea ice and another for lake ice - can be accessed online through the Canadian Cryospheric Information Network (CCIN) which was founded by Ellsworth LeDrew, a professor in Waterloo’s Faculty of Environment. LeDrew also co-created the Polar Data Catalogue (PDC) which is becoming Canada’s primary online portal for data and information from northern Canada and Antarctica.
“While we manage and preserve a great deal of data for scientists, we also recognize that major users of this information are the public and students,” said LeDrew. “The data are of very little value stored on disks. They have to be converted into useful information with on-line visualization and social media outreach so that they are accessible to everyone.”
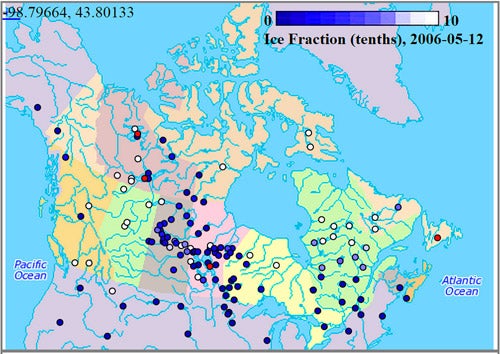
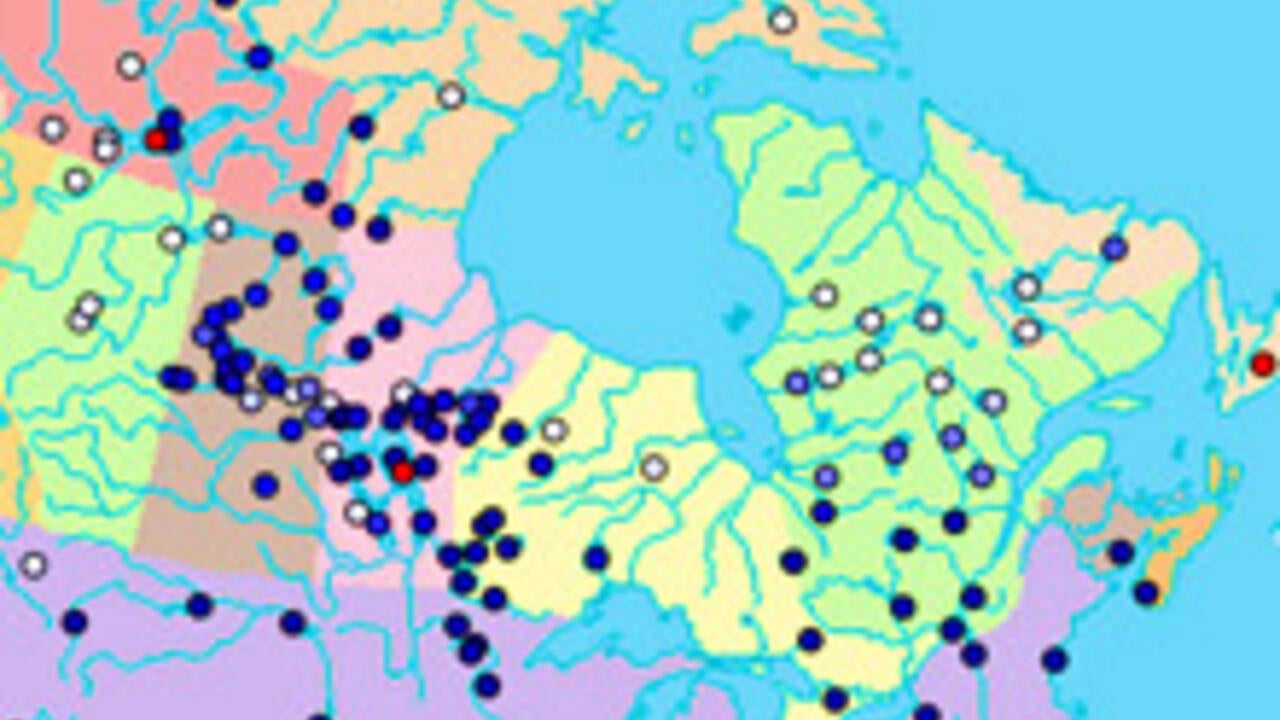
Lake ice levels as seen in an animation from the Canadian Cryospheric Information Network.
LeDrew says the animations are being released at a time when the maximum sea ice in the Arctic for March 2016 was the smallest in the history of satellite data interpretation. “Information from data informs the public and helps explain what is happening to their environment,” said LeDrew. “An informed public can help with informed public policy.”
The new animations were made public around the same time the World Meteorological Organization released 20 years’ worth of polar images. The Data Compendium: A Summary Documentation of SAR Satellite Data Collections, Plans and Activities, provides satellite images that can be used to measure changes in the Earth’s snow, ice, and permafrost during the last two decades, a time period when significant environmental changes have been observed in the polar regions.
The polar snapshots are available to the public in a PDF document (8 MB), developed by the Polar Space Task Group, which is an advisory group to the World Meteorological Organization.
The PDC contributed to the Data Compendium by hosting the 2008 full-continent RADARSAT-2 mosaics of Antarctica. In addition to nearly 30,000 RADARSAT images of northern Canada, the Antarctic images are available for public viewing and free download.
Environment Canada, the Canadian Space Agency, Indigenous and Northern Affairs, ArcticNet, and many other agencies across Canada and internationally are partners supporting Waterloo’s CCIN.