Guest post by Anton Mosunov, Math Undergraduate Group (amosunov@uwaterloo.ca)
Back in March I attended the Fields MathEd forum. The focus of this meeting was on research in math education and training of future math educators. A video of the session can be found here: http://www.fields.utoronto.ca/activities/22-23/meforum-Mar
I will share with you three interesting problems that were used by researchers in their studies. What do you find common about the nature of these problems?
1. What an Odd Triangle!
This problem was discussed by Prof. Jinfa Cai (University of Delaware). Consider the first five rows in the following triangle with infinitely many rows:
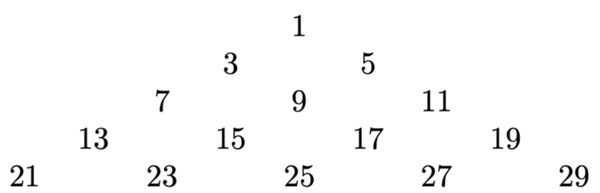
In this triangle the first row contains number 1, the second row contains numbers 3 and 5, the third row contains 7, 9 and 11, and so on. The teachers were then divided into three groups and given three prompts:
- Pose three different mathematical problems that could be solved based on this pattern.
- Pose one easy mathematical problem, one moderately difficult mathematical problem, and one difficult mathematical problem.
- Make three different mathematical conjectures about the pattern.
Teachers came up with all kinds of problems, such as
- What is the next row of numbers?
- How many values does the 17th row have?
- What is the sum of the numbers in the first 100 rows?
The last question led to the discovery of the beautiful formula that the sum of the first n cubes is equal to the n-th triangle number squared:
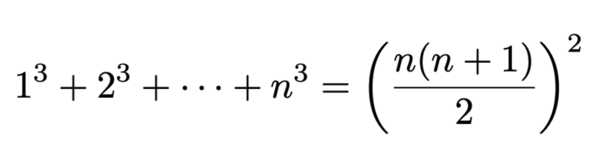
Can you see where this formula is hiding in the odd triangle?
2. Extending the notions of Least Common Multiple and Greatest Common Factor to Rational Numbers
The next motivating problem was posed by Prof. Rina Zazkis in her joint work with Prof. Boris Koichu. What is the period of the function h(x) = sin(8x/3) + sin(16x/9)? While the answer is not immediate, it certainly makes sense to us that such a period must exist, and with a bit more thought we could probably conclude that it must be a rational multiple of pi. What is less obvious is that the question of finding such a period has a direct relationship to generalizing the notions of the Greatest Common Factor (GCF) and the Least Common Multiple (LCM) of two positive integers that we are so used to! So let a/b and m/n be two positive rational numbers. Here are some definitions:
- We say that m/n is an extended multiple of a/b, or equivalently that a/b measures m/n, if and only if there exists a positive integer k such that (a/b)*k = (m/n).
- The smallest positive rational number which is an extended multiple of both a/b and m/n is called their extended least common multiple.
- The largest rational number which measures both a/b and m/n is called their extended greatest common factor.
Of course, these notions are not new. In fact, this is how Euclid described his Euclidean algorithm, talking about two line segments, A and B, with A measuring B, as opposed to two positive integers, with one dividing the other. With Euclid’s definition, a line segment of length (3/4)*pi measures a line segment of length (9/4)*pi, and so it would then makes sense to apply the division algorithm to these two quantities. So, can you see in what way the period of h(x) = sin(8x/3) + sin(16x/9) is connected to the extended least common multiple? And what is the relationship between extended LCM/GCF of a/b and m/n and standard LCM/GCF of positive integers a, b, m and n?
3. What is the graph of x^k?
Can you sketch f(x)=x^k? This question was posed to the audience by Rina Zazkis and followed by a request to resist the urge to use graphing software. Of course, our instinct is to ask: what is k? Because depending on the value of k the shape of the graph may change quite significantly. Together with Dr. Ofer Marmur, Prof. Zazkis investigated how students would make sense of functions with irrational exponents, such as x^sqrt(2), by showing them graphs of x^k with rational k. Naturally, many expected that the graph of x^sqrt(2) should be in between x^1.4 and x^1.48, but this is not quite the case! Do you see why? And can you figure out how many different shapes are there for f(x)=x^k when k is a rational number?
Marmur, O. & Zazkis, R. (2021). Irrational gap: Sensemaking trajectories of irrational exponents. Educational Studies in Mathematics, 107(1), 25-48.