By: Sanghyeon Song
Since the Industrial Revolution, human activities have released significant amounts of greenhouse gases (GHGs) such as carbon dioxide and methane, driving climate change. Methane, a potent greenhouse gas, is responsible for about 25 per cent of the global warming we experience today. Although methane remains in the atmosphere for about a decade, it has a global warming potential 29.8 times greater than carbon dioxide over 100 years. In the near future, however, it will be 82.5 times more potent than carbon dioxide over 20 years due to its short lifetime. This makes reducing methane emissions a highly effective strategy for mitigating climate change.
In Canada, policies have been implemented to reduce methane emissions from human activities, but setting meaningful reduction targets requires accurate estimates of current emissions. Environment and Climate Change Canada (ECCC) publishes annual National Inventory Reports (NIR) detailing greenhouse gas emissions, including methane, by sector and region. However, these reports lack a critical piece of information: a detailed map of methane emissions across the country.
Mapping Human Caused Methane Emissions on a National Scale
Most methane inventory reports at regional and national levels do not include the spatial distribution of emissions. However, some studies have successfully mapped methane emissions from human activities based on inventory and other data.
- In the U.S., Maasakkers et al (2016) mapped methane emissions by sector using the 2012 U.S. Environmental Protection Agency inventory of detailed data from state, county, sub-county, and point sources. They distributed emissions using a 0.1° × 0.1° grid.
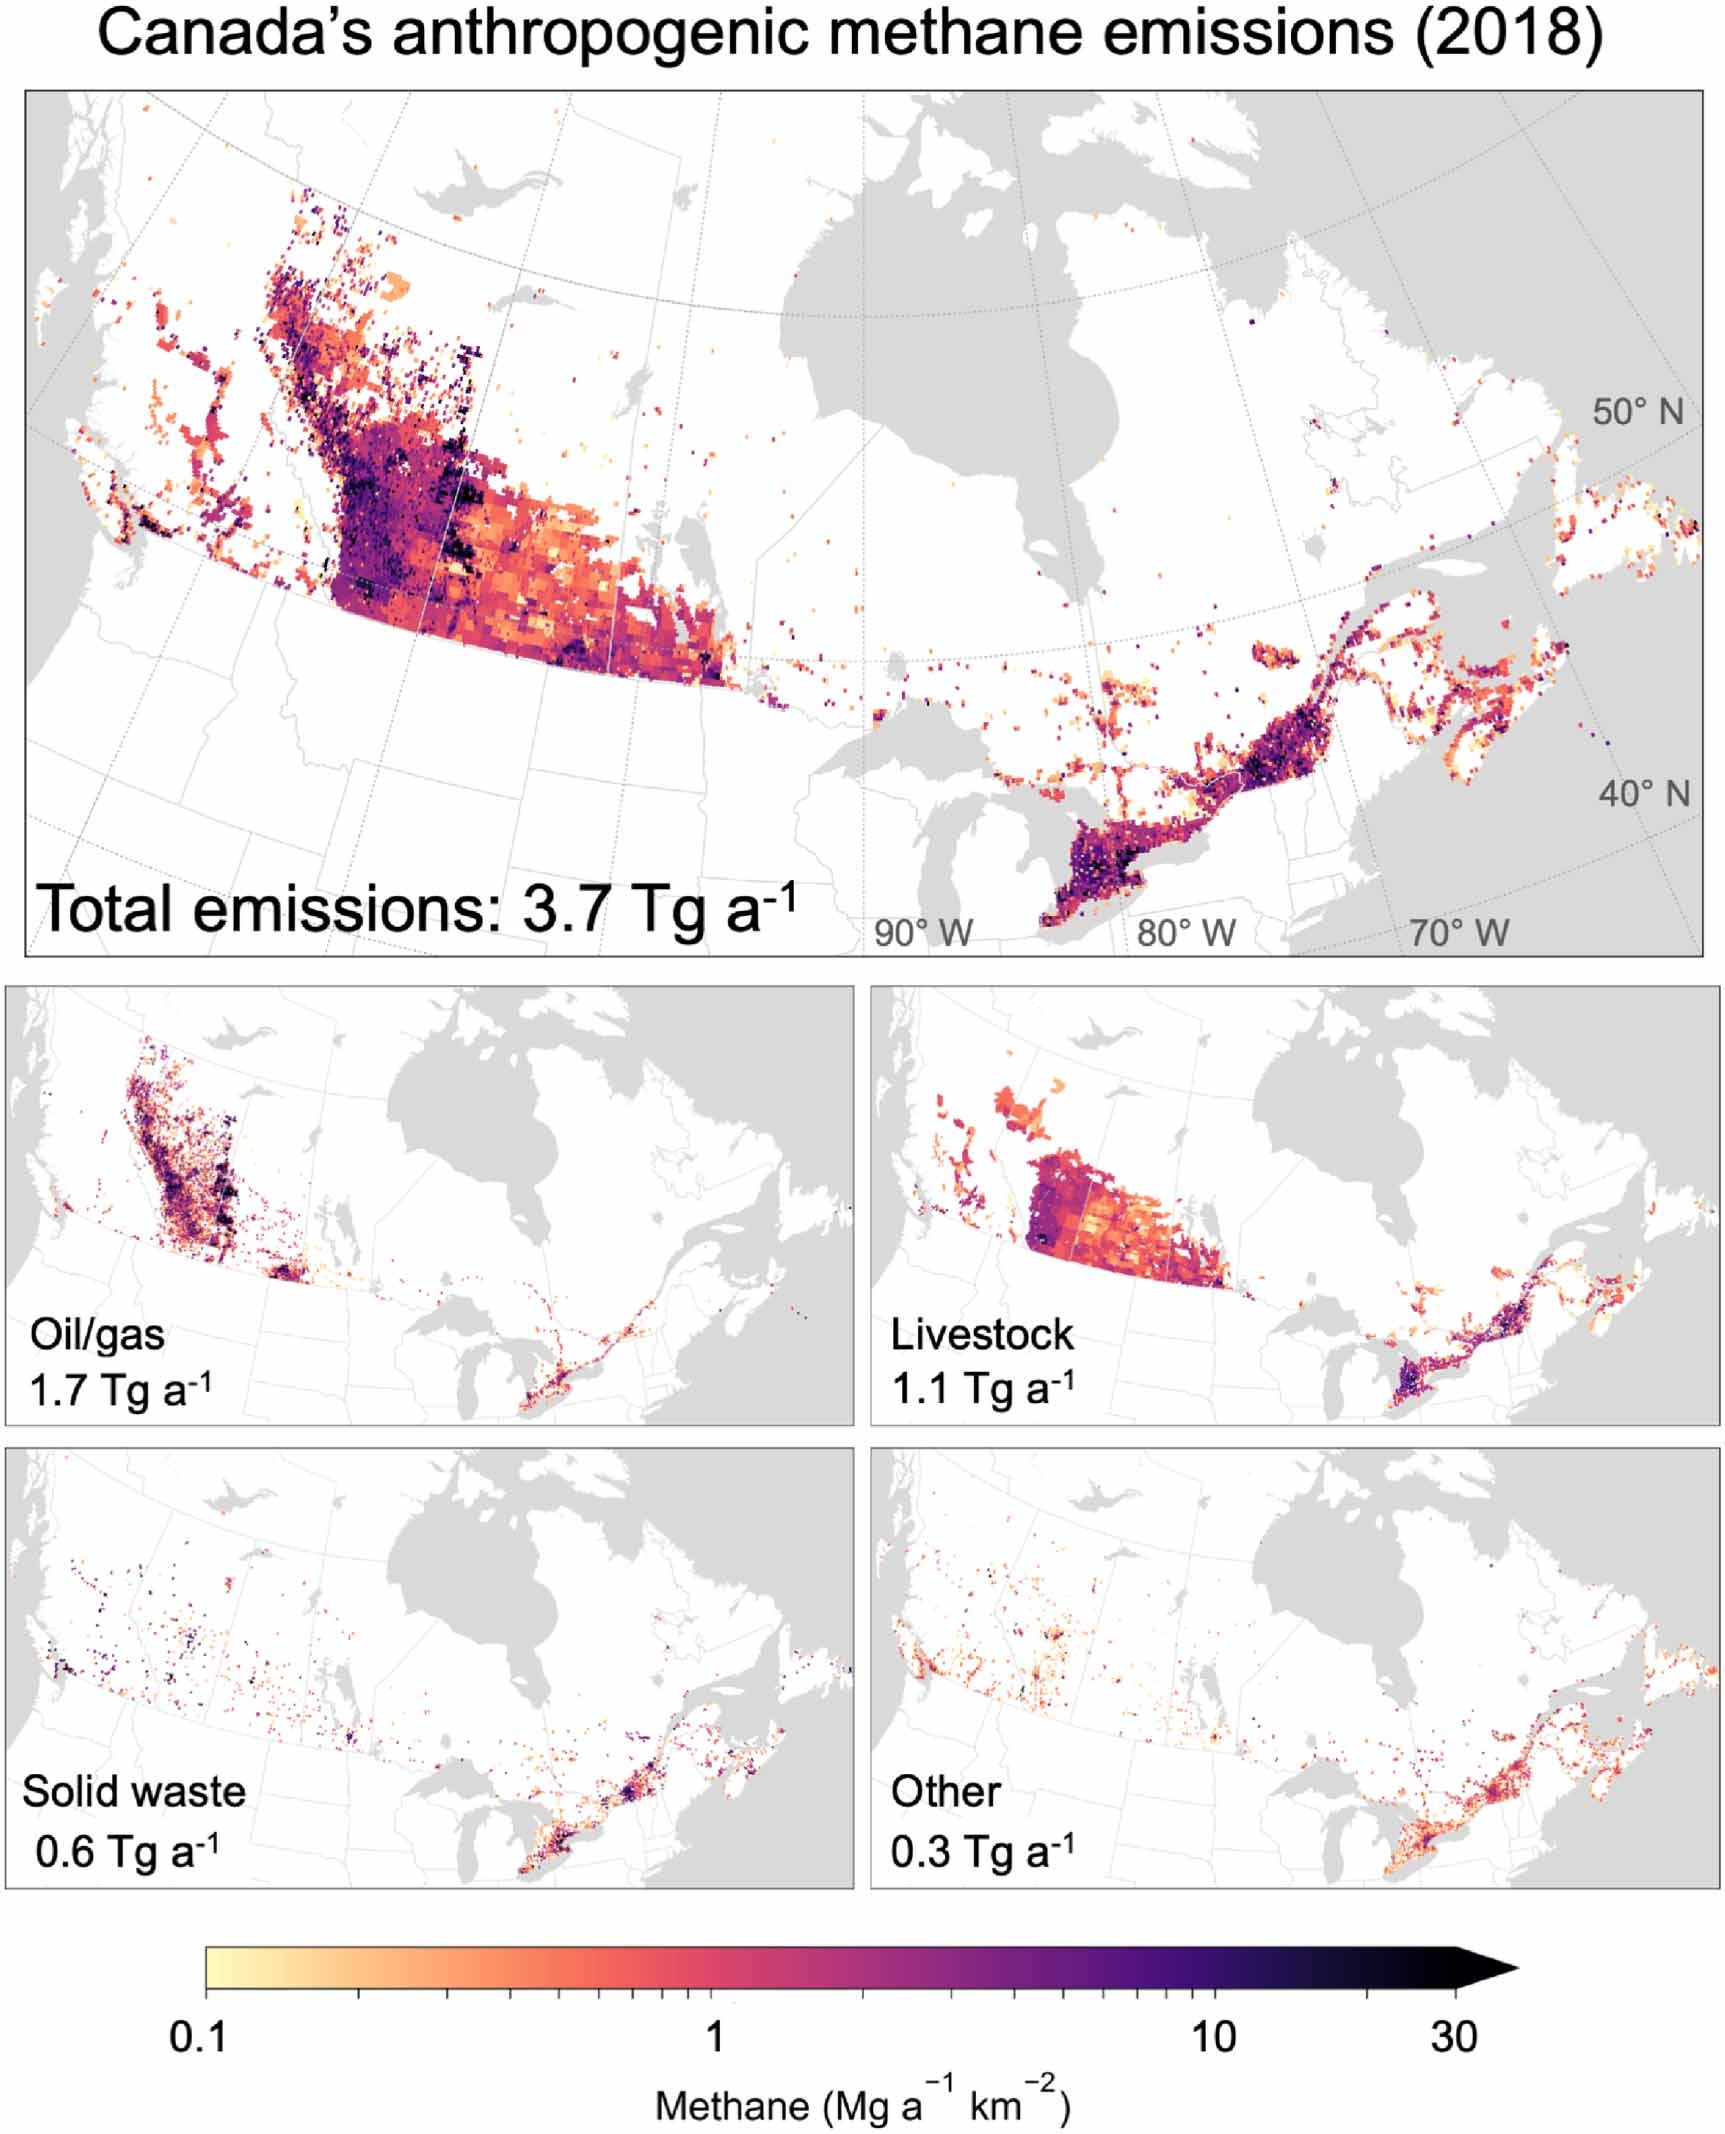
- In Canada, Scarpelli et al. (2022) created a similar map for 2018, focusing on anthropogenic methane emissions. They used the Canadian NIR, along with geospatial datasets and Greenhouse Gas Reporting Program data from ECCC to pinpoint emissions at specific locations within a 0.1° × 0.1° grid.
The resulting maps, such as the one shown in Figure 1, provide a clear picture of the annual and sectoral methane emissions across Canada.

Figure 1 Map of methane emissions from human activities in Canada in 2018 based on 2020 NIR and spatially allocated on 0.1° × 0.1° grid (Figure from Scarpelli et al., 2022)
Major Sources of Human-Caused Methane Emissions in Canada
In 2022, 94 per cent of Canada’s methane emissions from human activities came from three main sectors:
- Oil and Gas Industry: This sector is the largest source, contributing about 49 per cent of Canada’s methane emissions. Methane is released during the extraction, processing, transportation, and distribution of oil and gas. Fugitive emissions—leaks from equipment —are particularly concerning as they often go undetected without proper monitoring.
- Agriculture: This sector accounts for approximately 27 per cent of Canada’s methane emissions, mostly from livestock. Cattle, in particular, are a significant source. They produce methane during digestion through enteric fermentation. Additionally, methane is emitted through manure management practices, especially when manure is stored or treated in liquid systems like lagoons or pits.
- Waste Management: Landfills and wastewater treatments are responsible for around 18 per cent of methane emissions. As organic waste decomposes anaerobically (without oxygen) in landfills, methane is produced. While some landfills capture this methane for energy use, a significant amount still escapes into the atmosphere. Wastewater treatment produces methane from its anaerobic processes.
Why Mapping Methane Emissions Matters
Mapping methane emissions is essential for several reasons:
- Targeting Reduction Efforts: Identifying and quantifying methane emissions by location and sector is crucial for managing and reducing their climate impact. Accurate maps help allow pinpoint the sources, assess their impact, and develop targeted strategies for reduction.
- Tracking Progress: Mapping emissions over time enables policymakers, stakeholders, and the public to monitor progress toward emission reduction targets. It highlights areas where reductions are occurring and where additional efforts are needed.
- Managing Natural Resources: In Canada, it is especially important to geolocate anthropogenic methane emissions due to the significant natural emissions from wetlands, including peatlands, in the Boreal-Arctic Regions. These areas function as both methane sources and carbon sinks. Accurate mapping is important to manage these landscapes effectively, ensuring they continue to act as net carbon sinks while addressing the emissions from human activities.
Looking Ahead
As we move forward, mapping methane emissions from human activities will be critical for establishing, implementing, and managing methane mitigation policies. In the Boreal-Arctic regions, where human activities intersect with sensitive peatlands, these maps will also be key to managing these ecosystems, ensuring they remain effective carbon sinks while minimizing methane emissions.