The CIW produces both national and provincial (Ontario) index reports. To inquire about sponsoring a report for your province, please contact us.
About our index
The CIW composite index provides a single number that moves up or down like the Toronto Stock Exchange (TSX) or Dow Jones Industrial, giving a quick snapshot of whether the overall quality of life of Canadians is getting better or worse.
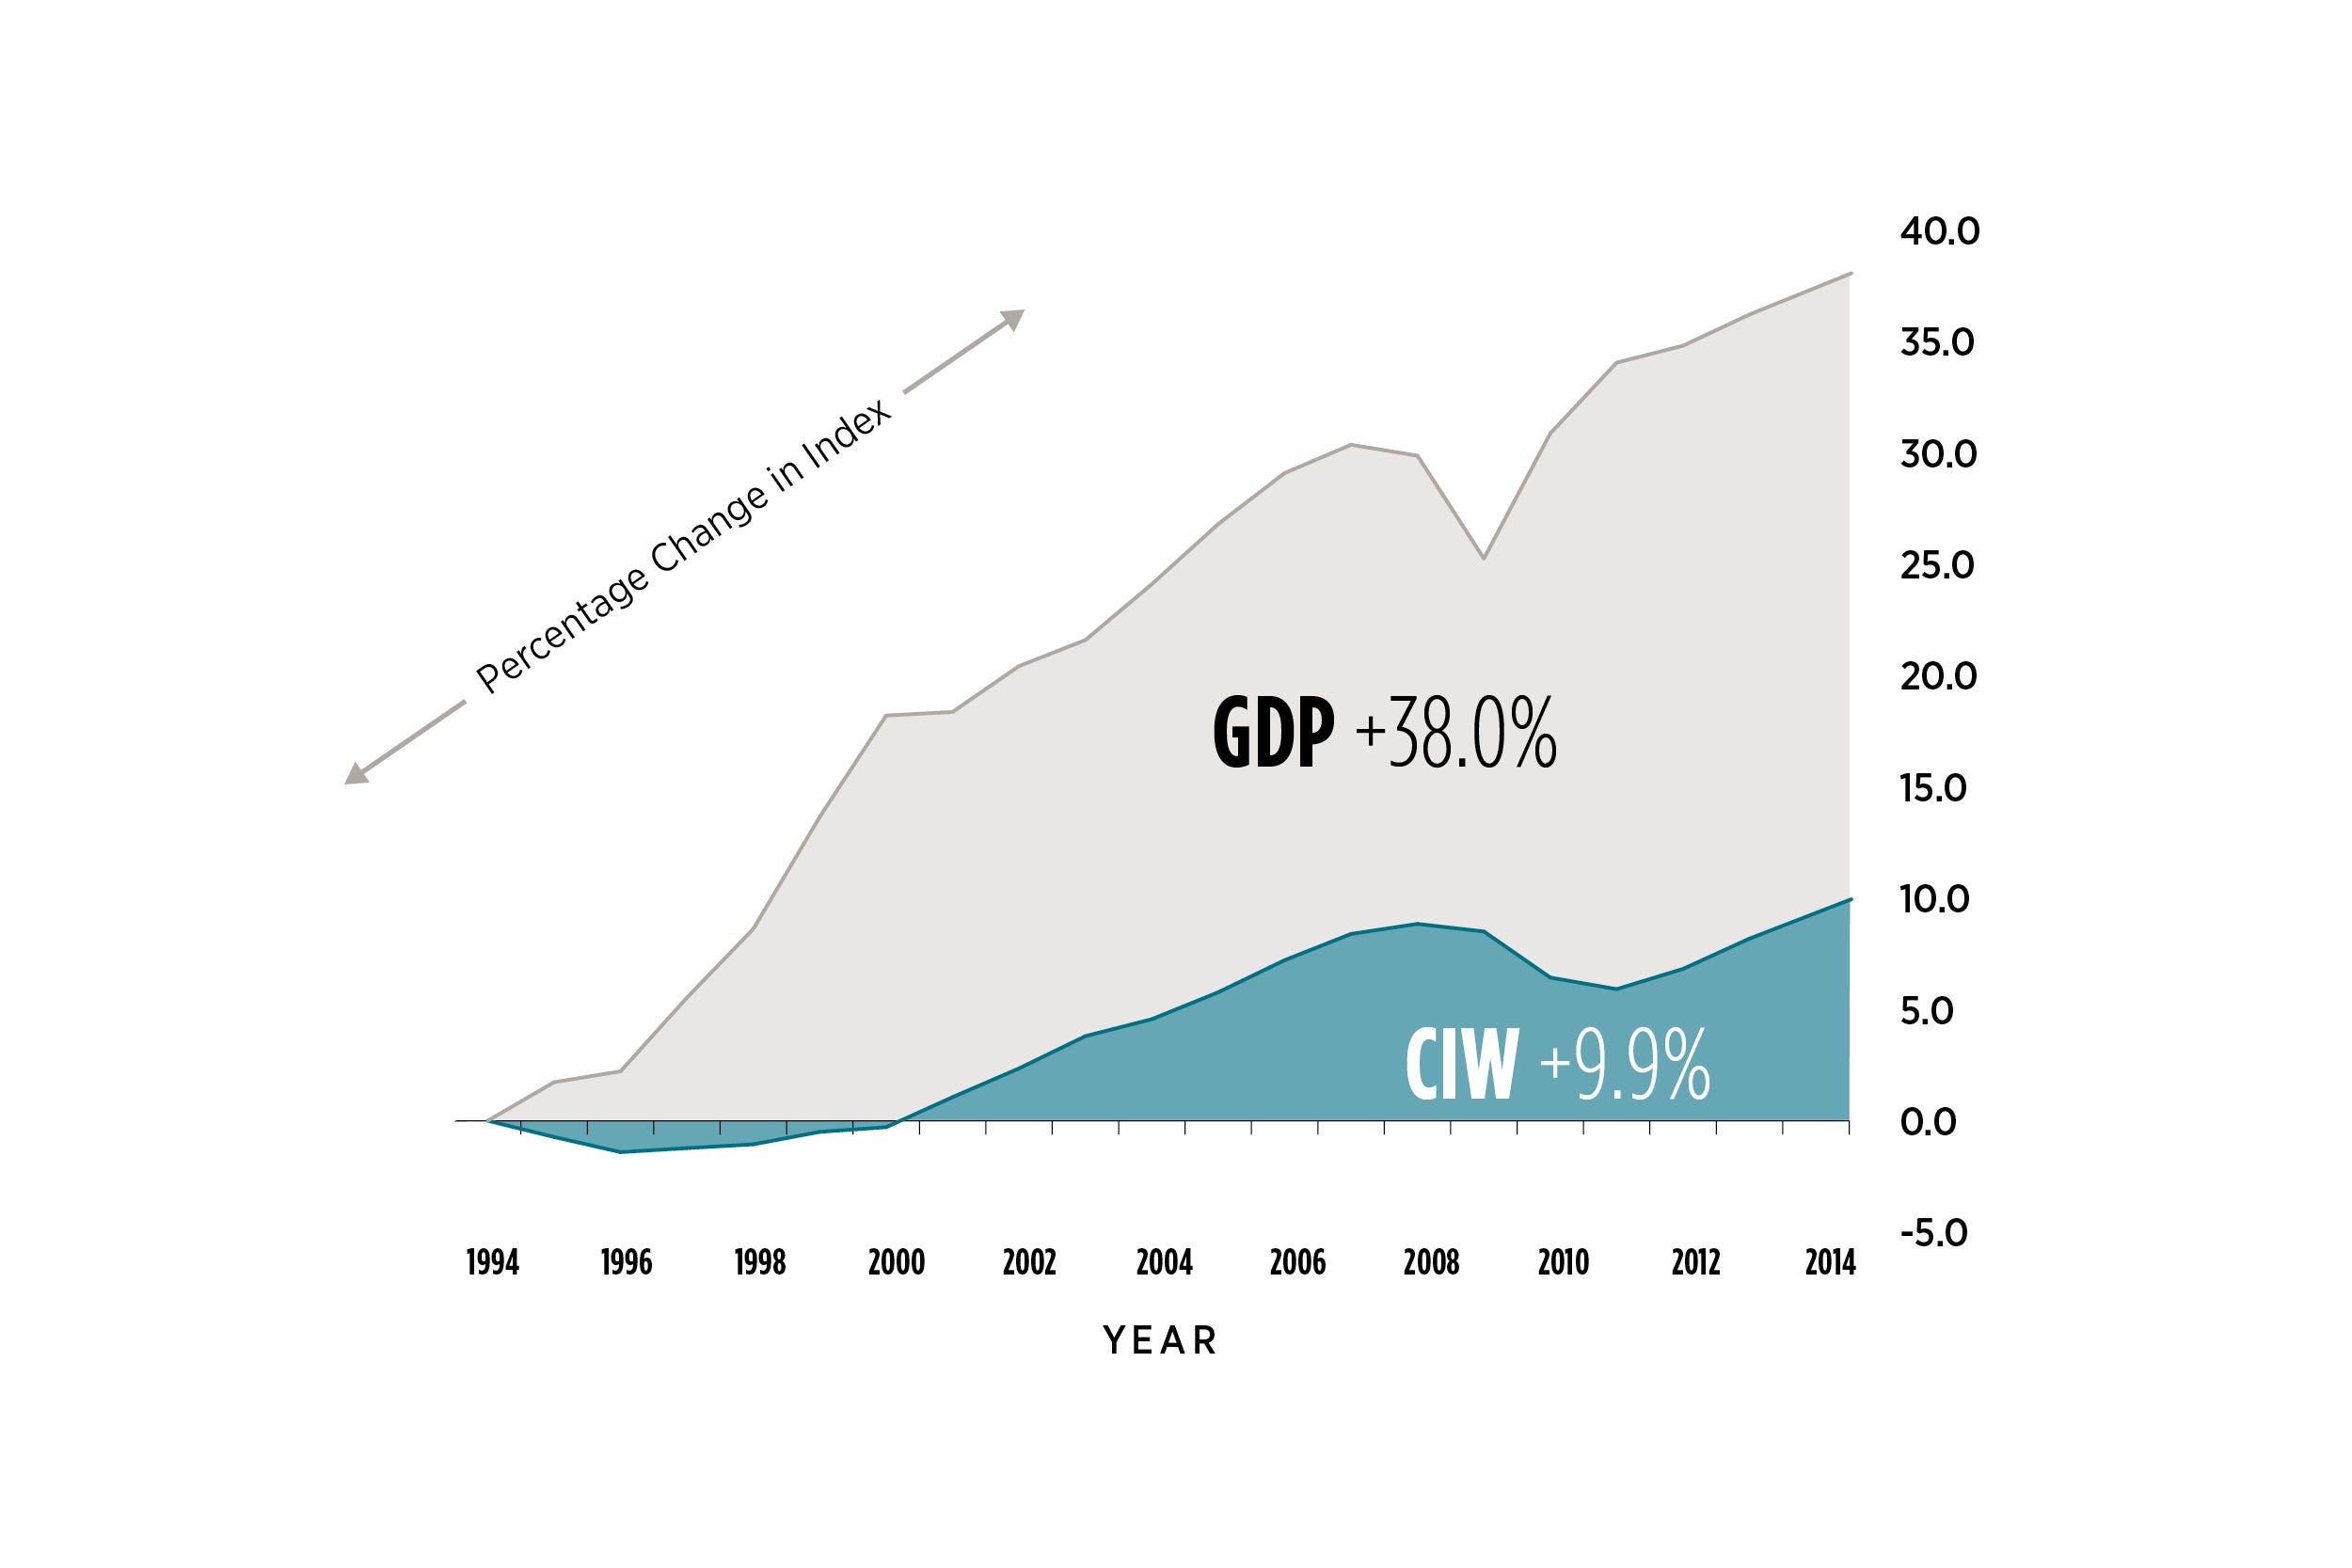
Releasing a single number, using plain language and compelling visuals, makes it easier to inform and educate the general public on the concept of wellbeing. Figure 1 from the third release of the composite index in November 2016 illustrates that Canadians’ quality of life has not improved at anywhere near the pace of economic growth as measured by GDP. Since 1994, Canada’s wellbeing has seen an overall improvement of 9.9 per cent – paling in comparison to the 38.0 per cent growth in the country’s GDP over that same time frame.
Methodology
Our base year for tracking data is 1994, due to the majority of health statistics drawn from the various cycles of the National Population Health Survey which began in 1994. Selection of 2014 as our final year of review for our 2016 report was determined by the availability of the most comprehensive set of data across all eight domains. To create comparable index values from our raw data values, the baseline values of each of the 64 headline indicators has been set at 100. Positive percentage changes for each one indicate some improvement in wellbeing while negative percentage changes indicate some deterioration.
Briefly, here is a description of the process we use:
- All of the 64 indicators are compiled into a spreadsheet, 8 indicators for each of the 8 domains, using the original units of measure. For example, the indicators might be measured as a percentage of the population (e.g., voter turnout in Democratic Engagement), a scaled response (e.g., people’s self-reported health on a 5-point scale in Healthy Populations), another index (e.g., Crime Severity Index in Community Vitality), or as an objective measure of some tangible feature (e.g., greenhouse gas emissions in Environment).
- Each indicator is recorded for all of the years for which we report trends (e.g., in our 2016 report, each indicator is recorded for the years 1994 to 2014). This is where the first challenge is encountered as data points are not available for every year. For example, almost all of the indicators in Living Standards are available for every year but for other domains, like Community Vitality and Time Use, several of the indicators come from national surveys that are conducted on 3 to 5 year cycles. We record the “real” data points for the survey years, then estimate the values for the intervening years, using the last data point and the next data point in the time series.
- Once a spreadsheet is complete for each domain (i.e., 21 rows of years, 1994 to 2014, BY 8 columns of indicators within a domain), another spreadsheet is created, setting the base year of 1994 to 100 for all indicators, so that the percentage change for a specific year from the base year (using the original data) can be calculated. This provides trends for each indicator, measured in the same units – percentage change.
- The average percentage change for all 8 indicators within a domain for each year is then calculated to get the trend for the domain, with the last year (e.g., 2014 in our 2016 report) reflecting the percentage change over the entire time period.
- Finally, an average of the percentage change in all eight domains for each year is calculated to get the overall trend in wellbeing – our composite index of wellbeing, the CIW.
A more detailed description of the methodology can be found in the full technical composite paper (PDF).
Our national index report
Read our National Index Report: How Are Canadians Really Doing? (PDF)
Is our overall quality of life getting better or worse? Are we getting closer or moving farther away from realizing the kind of Canada we want to live in?
Overall key messages
- There is a massive gap between how well the economy is doing and Canadians’ wellbeing– and it grew after the 2008 recession.
- The 2008 recession stole our leisure time, our volunteer time, our living standards, even our sleep – and we never got it back.
- The CIW provides a valid indicator of what is meaningful to Canadians.
Read How Are Canadians Really Doing? (PDF) and ask yourself is this the Canada you want? Where did the benefits from our economic growth go? Why is Canada still creating one of the world’s largest Ecological Footprints when individual Canadians are successfully reducing our Green House Gas emissions? Why are we living longer, but experiencing poorer health? How did the lion's share of gains in income and wealth end up going to the richest 20%, while the gap down to the rest of us is growing even larger?
In these uncertain times, we are fortunate to live in a country where we still have choices about how we want the future to look. Each of us has the power to voice – or not – our choices about the kind of society in which we want to live. The CIW provides a depth of understanding that can help steer Canada forward and build a society that responds to the global call for greater fairness. We challenge you to start talking about the future you want, so that all Canadians can enjoy the highest possible wellbeing status.
Our provincial index report
How are Ontarians Really Doing? (PDF) (2014) is the first provincial report to draw on the research used for the CIW’s national index. Spanning the turbulent period from 1994 to 2010, it tells the story of Ontario’s successes and challenges in each of the domains of wellbeing and makes comparisons to the rest of the country. It provides insights based on trends over that 17-year period and offers innovative policy options to build on strengths and address areas of concern.
From 1994 to 2010, Ontario experienced a period of extreme uncertainty. For a province accustomed to being an economic engine for the country, changes in economic conditions hit hard. The recession hit earlier, lasted longer, and had a larger impact in Ontario than for Canada as a whole. By 2011, Ontario had still not fully recovered. While the economy is just the backdrop to the story of Ontario’s wellbeing, it has had a significant impact on many aspects of our lives.
This report identifies highs and lows, points of tension, and the underlying complexity in Ontarians’ quality of life:
Significant progress in domains of Education, Community Vitality, and Healthy Populations
- High marks for Education in Ontario (+36.0%)
- Safer and more caring communities (+15.4%)
- Complex signs and symptoms for Healthy Populations (+5.6%)
…is in stark contrast to the stagnation in Democratic Engagement and Time Use, an overall decline in the Environment, and downward trends in Leisure and Culture and in Living Standards, which lag far behind the Canadian average.
- Ontarians are ambivalent about democracy (+1.7%)
- Still caught in the time-crunch (+1.1%)
- No progress for the planet (-1.9%)
- Where have all the good times gone? Less time for Leisure and Culture (-5.9%)
- Ontarians are feeling acute economic anxiety. Ontario’s Living Standards fell by almost 23% in three years (from +29.2% in 2007 to +6.5% in 2010)
Writing the next chapter together
There is nothing inevitable or unavoidable about the challenges we face. This is our province, our country, and we have a role — in fact, a responsibility — to define the next chapter of our future.
Collectively, we require nothing more than imaginative ideas, resolve, and public policy that place wellbeing at its very heart.