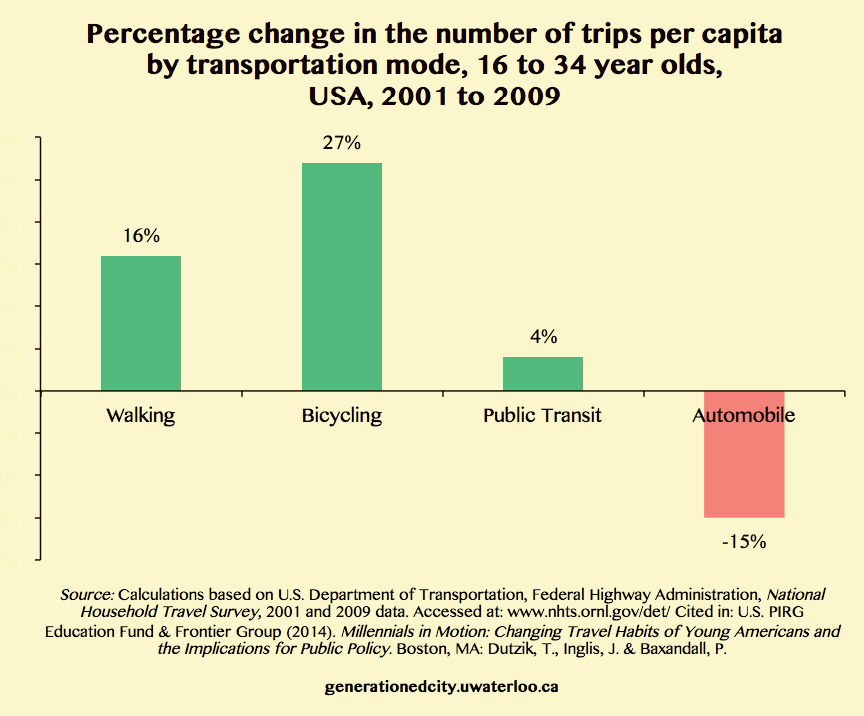
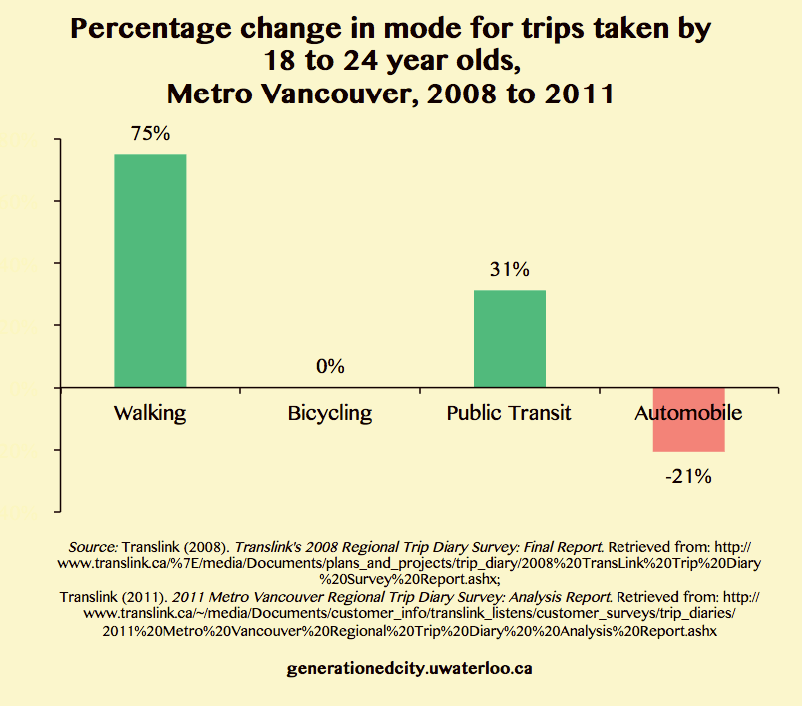
A recent article in CityLab describes how “[i]n 2013, transit ridership in the United States hit a 50-year high, with the nation’s transit systems logging 10.7 billion rides”. Young adults are increasing their use of public transit to get from home and work, and to other destinations–a trend we also observe in Canada.
Several, likely complementary, explanations exist for the changes in transportation patterns. Some of these explanations are:
- Increasing centralization of young into high density neighborhoods where transit is more prevalent
- Increasing environmental concerns
- Affordability of transit over car ownership
- Preference for urban lifestyle in large metropolitan areas
- Ability to work or use social media on public transit
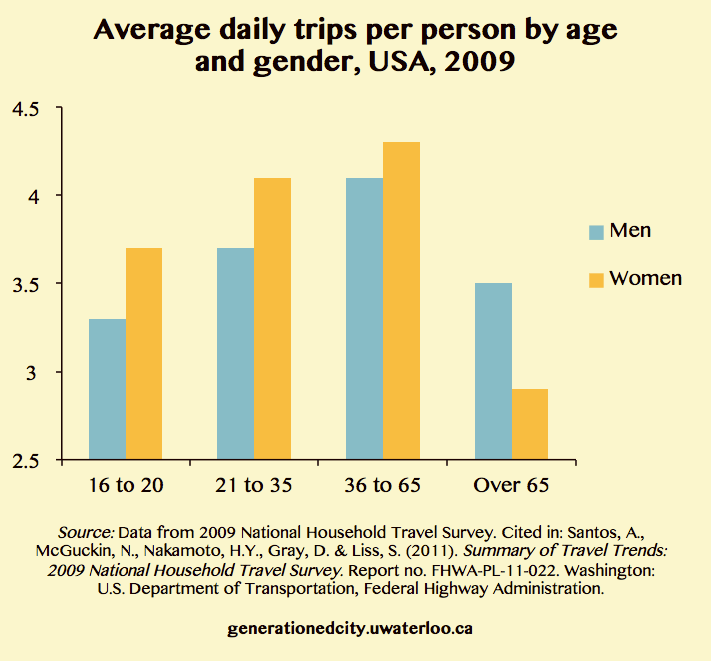
- Delay and decline in child bearing (older households tended to drive more and make more trips in part because the increase in household size when having children)
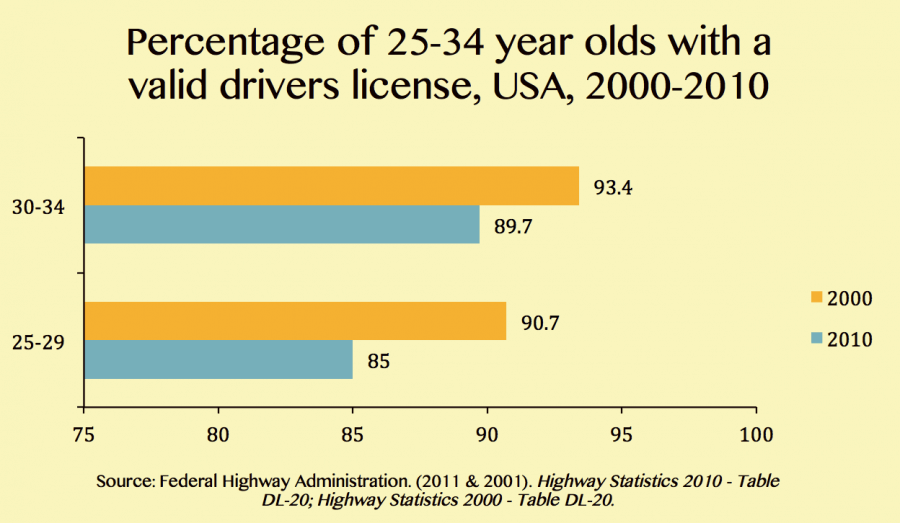
- Decreased need for a driver’s license with more young people living in cities with developed transit systems
- Often faster to take transit in congested metropolitan areas
- Increased enrollment in colleges and universities—many of these are in cities with decent transit systems
- Student bus passes get young used to riding transit earlier on in life

In many ways, it is too early to tell whether or not today’s young adults will continue to drive less than their parents did as they age. And further research is required to unravel this complex issue.
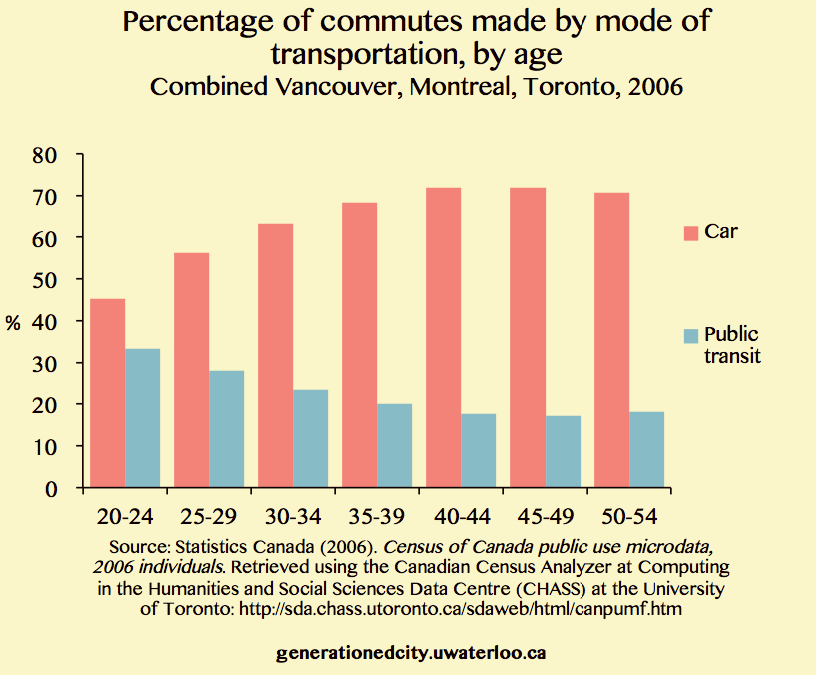
It is also important to remember that despite decreases in car ownership, driver’s licenses, and car use, the majority of young adults still use a car to get to work and for most other trips; and that there are stark differences in car use among young adults across metropolitan areas.
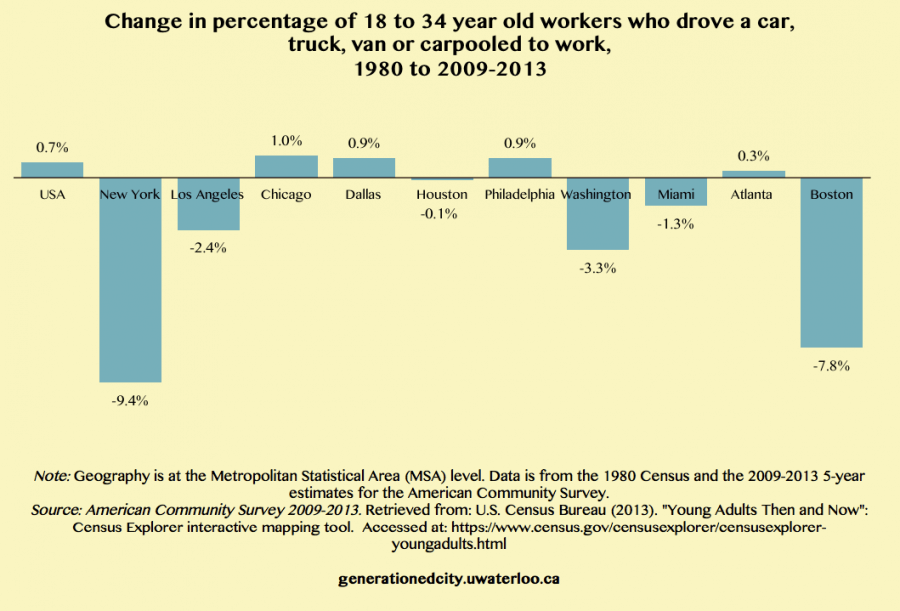
Another recent article in CityLab also revealed an interesting geography of where young adults are least and most likely to drive. It turns out that the decreases in car commuting occurred in places like Washington, Seattle and Los Angeles; while the increases occurred in places like San Diego, San Antonio, Baltimore, and Minneapolis.

These trends fit with our theory of “youthification” in that it seems that the centralization of young adults, and associated decreases in car use, are occurring in cities most successful in attracting a young, well-educated labor force to vibrant, high-density neighbourhoods.

Our goal at Generationed City is to understand more about what kinds of young adults are reducing their car use within and across different metropolitan areas, and why. We are using Census data and city-specific transportation surveys to conduct some of this analysis.