SLUCE's Original Model for Experimentation (SOME) - Residential Location Model
Overview
 An important part of the modeling process is the development of simple models to help us train our intuition about the causes and implications of a pattern we observe in reality. These simple models can help us to understand our assumptions about how human decision-making, ecological processes, and interactions among modelled components affect each other and aggregate to produce macro or system level outcomes.
In the presented model (SOME – SLUCE’s Original Model for Experimentation), we considered the question of how different behavioral assumptions affect the extent of sprawl. This website allows the user to explore the SOME model of residential location. Through this website, we hope that you will see this simple model as a tool to help generate and evaluate hypotheses about residential location and settlement patterns, learn about agent-based modelling, and see the utility of simple models that can be used to form the basis of larger and more complicated models.
What follows is a guide through the SOME model, accompanied by a series of experiments and questions that will get you thinking about the behaviour of the model, and agent-based modelling and residential sprawl more generally. While this website was developed by D. Robinson, the conceptual developments and initial NetLogo models were developed by Dr. Daniel Brown and the greater SLUCE research team at the University of Michigan. A list of research papers that have extended this model or used this model as inspiration is given at the end of the webpage.
Description of the SOME Model
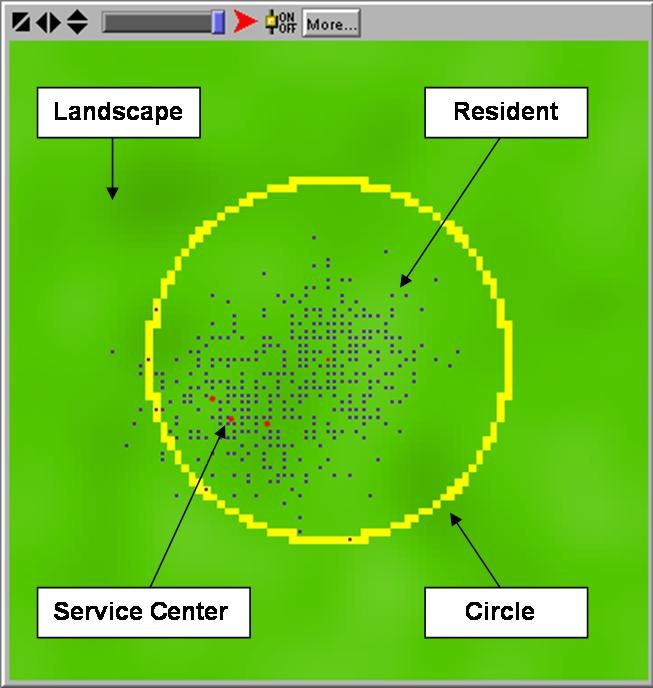
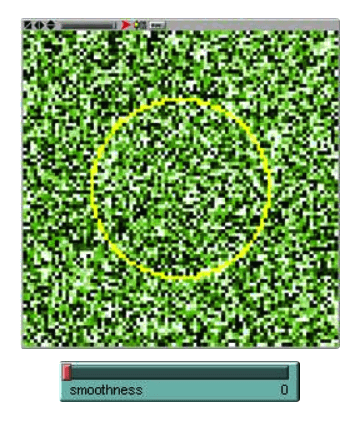
The SOME model has four components that are visible upon setup and watching a model run. The Landscape, Residential Household Agents, Service Center Agents, and a sprawl measurement boundary (a yellow circle). The model is initialized with a Service Center Agent at the center of the landscape (red dot), surrounded by the sprawl boundary, in a landscape of aesthetic quality. Residents that locate outside of the sprawl boundar are counted as sprawled residential settlement units (black squares). The number of sprawled units provides a measurement for comparison between different model settings and the overall level of sprawl. The screen capture below shows the landscape and model components after running a few time steps.
The model is initialized with a service center located at the center of the landscape. The model moves forward in discrete time steps, whereby each time step could represent a month or a year. The link between the logical time of the model and real-world time has not been made explicit in this simple version of SOME, but has been made in the modelling papers in the reference section of this website. Each time step, 10 residential household agents are create and evaluate some number of locations to settle (numTests parameter). The settle at the location that maximizes their utility for aesthetic quality and nearness to urban service centers. After 100 residential household agents have settled a new service center agent is created and locates near the last residential household agent.
The Landscape
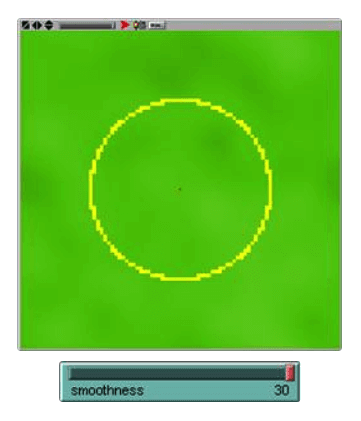
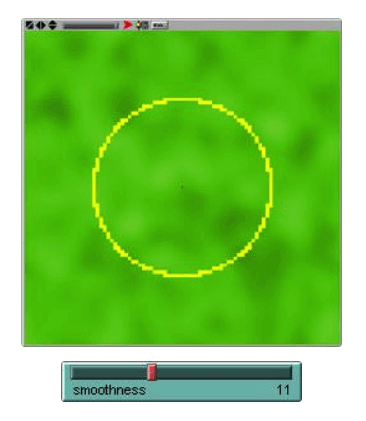
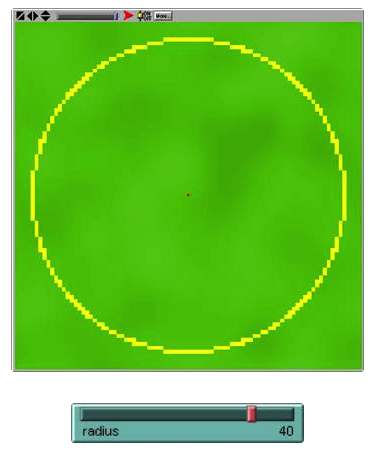
The SOME model is situated in a hypothetical landscape that has a single environmental variable, environmental beauty or as we refer to it, aesthetic quality. The aesthetic quality of each cell is set at the beginning of each model run using a random map that is smoothed to some degree, specified by a smoothness parameter (called “smoothness”). The smoothness parameter creates a coarser grained (i.e. smoother) pattern of aesthetic quality at higher parameter values. With no smoothness, the aesthetic values of the landscape vary greatly and are completely random. With a high smoothness, the values change little from place to nearby place. With the model you can move the slider on the smoothness widget to change the landscape smoothness. (The aesthetic quality map could be read from a GIS data layer if we wanted to evaluate these dynamics in a particular place).
|
|
|
Residential Households
Residents locate themselves on the cells that maximize their utility. Residents evaluate utility by calculating a score for each sampled cell that is a function of that cell’s distance to nearest service center, that cell’s aesthetic quality, and the importance the resident places on distance and aesthetic quality. All residents prefer cells that are closer to a service center and have higher aesthetic quality.
utility of a cell to resident = ( ( 1 / sddist ) ^ alphaS * quality alphaQ ))
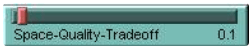
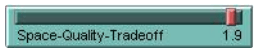
The distance of each cell to the nearest service center (sddist) is calculated each time a new service center enters. The importance residents place on aesthetic quality (alphaQ) and distance (alphaS) is set according to a parameter called “Space-Quality-Tradeoff.” If this value is 1.0, each factor is given equal weight in the calculation of utility. A value of 2.0 places all emphasis on distance, with no consideration of aesthetic quality. Conversely, a value of 0.0, forces the residents to consider only aesthetic quality, with no consideration of service center distance. All residents have the same utility function and parameter values.
|
|
Residents locate themselves on the cells that maximize their utility. However, they only get to sample some small number of cells before selecting one. The parameter “numtests” determines how many cells each resident gets to sample and, in this version of the model, it can be set to any value from 1 to 30 (15 is default). By providing the residents incomplete information about the cells in the landscape, this process represents a form of bounded rationality.
Measuring Sprawl
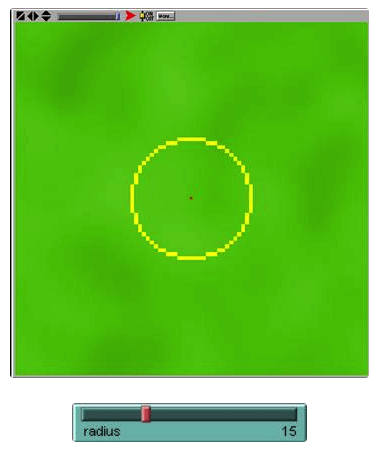
Because our interest has been in using ABMs to help understand urban sprawl, we have incorporated a measure of sprawl into the model. The measure is simply the number of developments (residents or service centers) that are located outside a specified distance radius from the center cell. The circle defined by this radius is displayed in yellow on the screen and can be changed using the “radius” parameter. At each time step, the cells that fall outside the specified radius are counted and the number is plotted on the graph. Model settings that locate more residents outside the radius at a given time step indicate a system with more sprawl.
|
|
Environmental Feedback
The model also has the ability to incorporate coupled human-environment interaction. You may switch this feature on and off with the ‘LUAB’ switch. With ‘LUAB’ (Land Use Affects Beauty) switched off residents evaluate the landscape but do not change the aesthetic value of the landscape. When ‘LUAB’ is switched on, each development reduces the aesthetic quality of the cells around it. This can result in changing the decisions made by the subsequent residents as they evaluate the aesthetic quality of available cells. This process can reduce desirability of locations selected early in the model run and can serve as a form of negative feedback.
Service Center Feedback
In addition to the influence of environmental feedback on agents location decision making is feedback between agents and service centers. Each time a new set of 100 residents locate in the landscape, a new service center locates by selecting a random direction and moving out from the last resident until it finds an unoccupied cell. This is a relatively crude approach to locating service centers, but it captures our intuition that services tend to locate near people, who can serve as both customers and employees. This process can reinforce the location decisions of early residents as a form of positive feedback.
Experiments

|

|
References
- 2013. Robinson, D.T., Shipeng, S., Hutchins, M., Riolo, R.L., Brown, D.G., Parker, D.C., Currie, W.S., Filatova, T., and S. Kiger. Effects of land markets and land management on ecosystem function: A framework for modelling exurban land-changes. Environmental Modelling and Software, 45: 129-140. DOI: 10.1016/j.envsoft.2012.06.016
- 2012. Rounsevell, M., Robinson, D.T. and D. Murray-Rust. From actors to agents in socio-ecological systems models. Philosophical Transactions of the Royal Society B 367: 259-269. DOI: 10.1098/rstb.2011.0187
- 2009. Robinson, D.T. and D.G. Brown, Evaluating the effects of land-use development policies on ex-urban forest cover: an integrated agent-based GIS approach. International Journal of Geographical Information Science 23(9): 1211-1232.
- 2008. Brown D.G., Robinson D.T., Nassauer J.I., An L., Page S.E., Low B., Rand W., Zellner M., and R. Riolo. Exurbia from the Bottom-Up: Agent-Based Modeling and Empirical Requirements. Geoforum 39: 805-818.
- 2006. Brown, D. G. and D. T. Robinson. Effects of Heterogeneity in Residential Preferences on an Agent-Based Model of Urban Sprawl. Ecology and Society 11(1): 46.
- 2005. Brown D., Riolo R., Robinson D.T., North M., and W. Rand. Spatial Process and Data Models: Toward Integration of Agent-Based Models and GIS. Journal of Geographical Systems (7)1: 25-47.
- 2005. Brown, D.G., Page, S.E., Riolo, R., Zellner, M., and W. Rand. Path dependence and the validation of agent-based spatial models of land use. International Journal of Geographical Information Science 19(2): 153-174.
- 2004. Brown, D.G., Page, S.E., Riolo, R., and W. Rand. Agent based and analytical modeling to evaluate the effectiveness of greenbelts. Environmental Modelling and Software 19(12): 1097-1109.