Experiment 1
Our first experiment considers an environment in which there is no heterogeneity in the aesthetic quality of the land. The sprawl boundary has been set at a 25 cell radius from the initial service center, located at the center of the landscape. Go to the SOME model or click on an existing browser tab where you have the model open. Once the new webpage opens click on the Exp#1. SMOOTH LANDSCAPE, LOW INFORMATION button and then the SETUP button.
The landscape should be initialized with aesthetic quality values, a sprawl boundary, a smooth landscape, luab off, and a sampling of ten locations (i.e., numTests) for each residential household agent. In this experiment, the residential household agents do not look at many locations before choosing a place to live. In fact, they consider only ten random locations, which in a landscape of 6400 locations represents a sample size of less than 1%. The sample size limitation reflects the imperfect or incomplete information that residents have when they choose a residence. Since there are several parameters that can be changed, you may want to create a worksheet in Excel and record the different parameter values and model results as you run the model multiple times and you may want to compare among model runs or between experiments.
When you are ready you can press the GO button and the model will run. If it seems like the model is running too fast to watch you can either run through the model one step at a time using the NEXT STEP button or you can move the 'speed' slider at the top of the NetLogo model. Run the model a couple times by repeating the procedure listed above to get a feel for how the SOME model works and how the process represented in the model produces the final outcomes you observe. Run the model at least five times and measure the amount of sprawl by recording the number of developments outside the radius at the end of the model run. You can read the numbers off the graph by pointing your mouse at the appropriate location on the graph. This will allow you to compare model settings for the degree of sprawl they produce. You can calculate the average and standard deviation for each model setting if you like for comparison with the other experiments.
Question 1. Describe the behavior of the model and why you observe the produced settlement patterns for one or two typical model runs?
Question 2. Does each run produce the same number of settlements beyond the urban growth boundary? Discuss why the number of settlements beyond the boundary do not change (or do change) each time the model is run. What is required to make a model stochastic or deterministic and how could we modify the SOME model to be one or the other?
Question 3. Run the model 20 times and record the number of settlements beyond the sprawl boundary. Compute the average and standard deviation. Discuss when you should report the average and standard deviation of model outputs and how this information might be used to determine how many times you should run a model with the same set of parameters.
It is easy enough to run and watch the model 20 times for each experiment because it is a simple model. It would be more efficient if you were able to run the model multiple times using the same parameter settings and have the software automatically record the results of those individual runs for you. It would be even better if you could have the model iterate a number of times for each of several parameter settings! NetLogo has a tool to do this, which is called Behavior Space. If you are feeling keen and want to try to set up Behavior Space for your experiments then you will have to download and install NetLogo on your computer, export the code for the SOME model from the SOME model page, and under the Tools menu item you can find the BehaviorSpace tool. The openABM initiative has a useful Behavior Space tutorial that may be of interest.
Question 4. What mechanisms in the model act as centripetal forces (cause increasing clustering) and which ones act as centrifugal forces (cause more sprawl)?
Experiment 2
Our second experiment investigates the effects of increasing the amount of information ("numtests") of each resident. In Experiment 1, residents selected the best location from a list of 10 locations. In this experiment residents evaluate 30 locations. We do not change the aesthetic quality of the landscape because we are interested in the effects of increasing information on settlement patterns. Go to the SOME model or click on an existing browser tab where you have the model open.
Once the new webpage opens click on the Exp#2. SMOOTH LANDSCAPE, HIGH INFORMATION button and then the SETUP button. The landscape should be initialized with aesthetic quality values, a sprawl boundary, a smooth landscape, luab off, and a sampling of 30 locations (i.e., numTests) for each residential household agent. While the evaluation of 30 locations is still a small sample (i.e., less than 1% of the study area) the results are notably different. Again, you should record the different parameter values and model results as you run the model multiple times and you may want to compare among model runs or between experiments. When you are ready, click the GO button and the model will run. Run the model 10-20 times and record the amount of sprawl at the end of each model run. Calculate the average and standard deviation for comparison with the other experiments.
Question 5. Describe the behavior of the model and how the parameter settings influenced the settlement patterns that were produced?
Question 6. How do the settlement patterns from this experiment differ from those in Experiment 1, were the patterns more or less clustered? Use both quantitative (mean and standard deviation) and qualitative (visual interpretation) results.
Question 7. Why is the graph initially flat? Is the number of settlements beyond the urban growth boundary increasing linearly, exponentially, or taking some other form? Can we expect this trend to continue in the modelled landscape (why or why not)?
Question 8. The decision-making approach used by the residential household agents in the model is called bounded rationality. Each residential household agent is making a rational decision to maximize its' utility from a subset of study area locations (i.e., numTests). Because the residential household agents are basing their rational decisions on a subset of locations the decision-making process can be referred to as bounded rationality. Describe what we can learn from changing the level of information available to an agent and relate it to the concepts of bounded rationality and rational decision making, which is sometimes referred to as homo economicus.
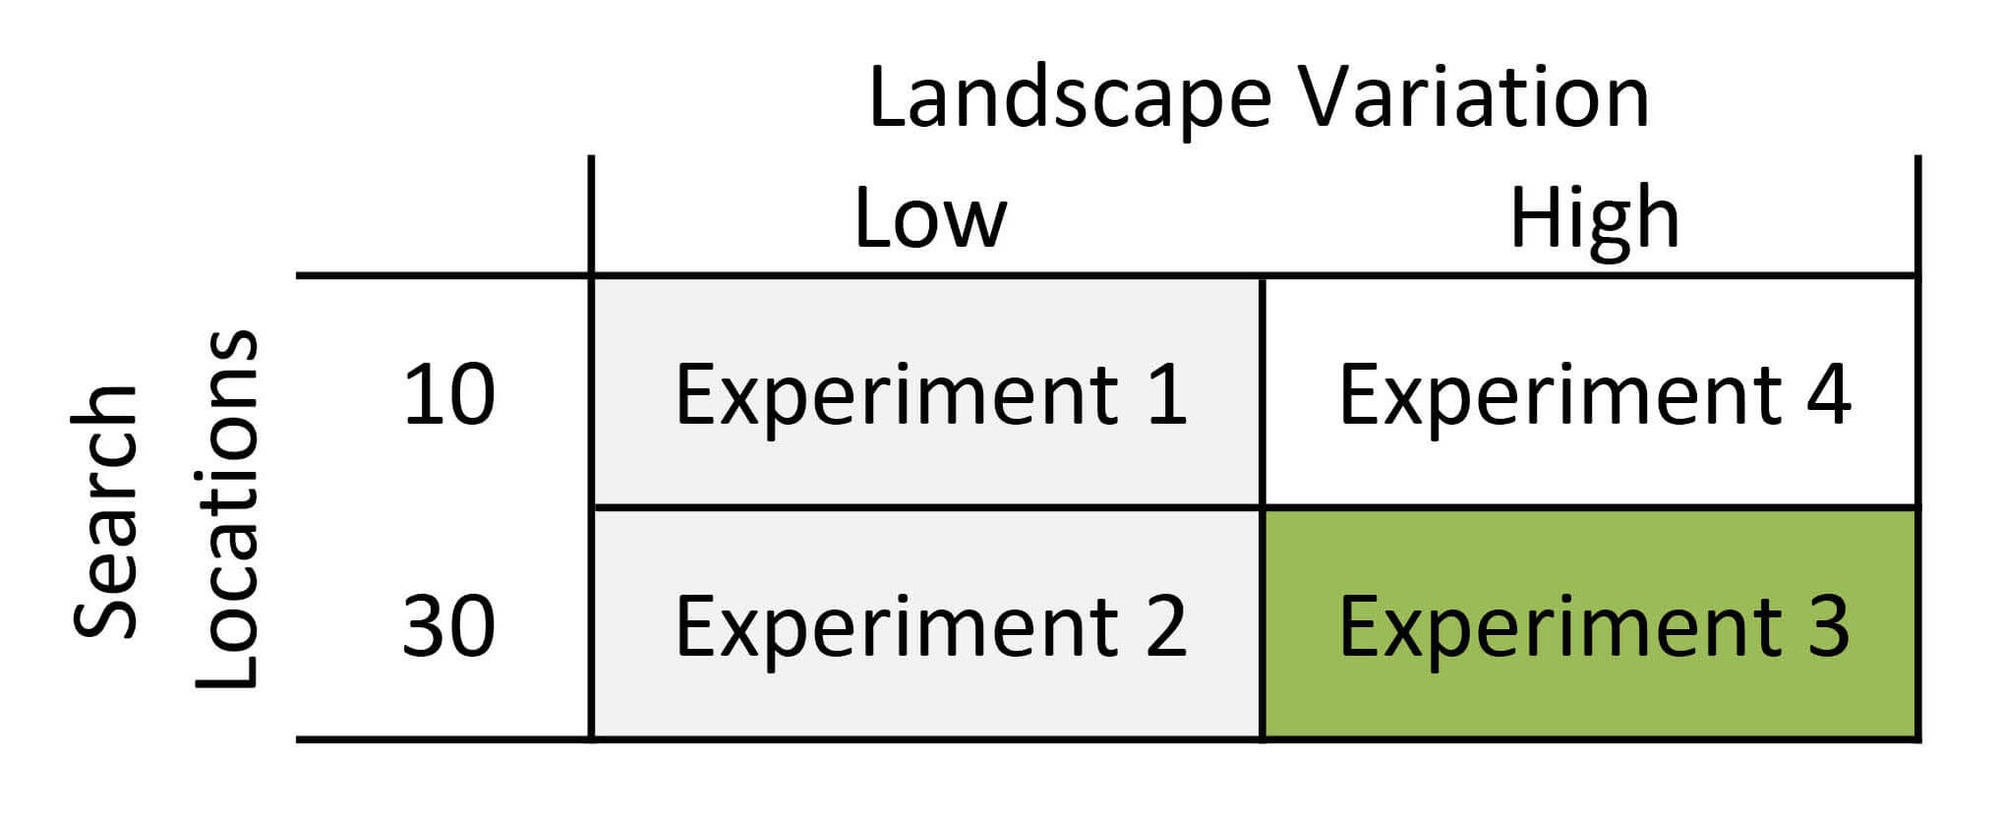
Experiment 3
Up to this point our experiments have explored the effects of changing the the level of agent information (as represented by the number of evaluated locations) in a relatively smooth landscape with little variation in aesthetic quality (grey cells in table below). In this 3rd experiment, residential household agents will continue to evaluate 30 locations, but they will do it in a landscape with greater variation in aesthetic quality.
Go to the SOME model or click on an existing browser tab where you have the model open. Once the new webpage opens click on the Exp#3. ROUGH LANDSCAPE, HIGH INFORMATION button and then the SETUP button. When you are ready, click the GO button and the model will run. Run the model 10-20 times and record the amount of sprawl at the end of each model run. Calculate the average and standard deviation for comparison with the other experiments.
Question 9. Compare and contrast this model behavior to the two previous experiments. Describe the differences or similarities among the experiments using the number of settlements beyond the sprawl boundary, the landscape patterns, and the shape of the graph.
Question 10. "All models are wrong but some are useful" (Box 1979, pg. 2) highlights the fact that by definition a model is a simplification of reality and inherently has flaws in the representation of reality within the structure of the model. However, this does not exclude the fact that a model can be useful and that models may ultimately be judged based on how useful they are. Conceptualize two or three uses that could demonstrate how or why this model, its results, or the agent-based modelling approach are useful. If you do not think the model is useful then argue why it is not. In either case try to provide some literature justification for your argument.
Box, G. E. P. (1979), "Robustness in the strategy of scientific model building", in Launer, R. L.; Wilkinson, G. N., Robustness in Statistics, Academic Press, pp. 201–236.
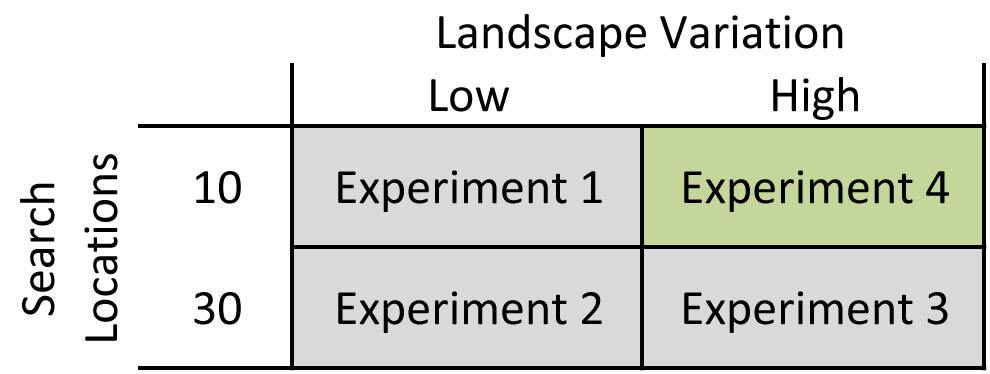
Experiment 4
You should now have completed the first three experiments (grey cells in the figure below), where you varied the number of search locations (i.e., numTests) and started to look at variation in the landscape as represented by aesthetic quality values. Each of these experiments had been predefined for you and the buttons at the top left of the model have set the parameters accordingly. We leave Experiment 4 and its analysis for you to create and conduct on your own. Go to the SOME model or click on an existing browser tab where you have the model open. Run the model 10-20 times and record the amount of sprawl at the end of each model run. Calculate the average and standard deviation for comparison with the other experiments.
Question 11. To answer this question develop a research question related to landscape variability and describe in 2-4 paragraphs the relevance of answering this question and how modelling can help answer this question. Use peer reviewed literature to help establish some context or identify research gaps that answering your research question may help to fill. If you're in the University of Waterloo GEMCC 630/GEOG 653 Land use and the carbon cycle then relate this back to some aspect of landscape variability that affects the carbon cycle or climate processes. If you're in another course using this website then think about the course content and the broader concepts in the course that are driven by or affected by landscape variability.
Experiment 5
Until now we have explored only the effects of information and landscape variation on residential settlement patterns and the amount of sprawl (as represented by settlements beyond the 25 cell radius sprawl boundary). Residential household agents have indirectly interacted with each other by occupying locations that could be settled by other agents and may even be more preferred by other agents. In this experiment we expand on this type of interaction by incorporating additional environmental or aesthetic impact from settlement by degrading the aesthetic quality locations that have been settled. To focus on this effect we use a smooth landscape with little aesthetic variation and focus on only one or two parameter changes so that we can interpret and learn about the different mechanisms in the model. If we were changing many parameters at once it would be very difficult to understand and learn from the model.
Question 12. Before you run the model make a hypothesis about how you think the pattern of settlement and the amount of sprawl will compare to the previous experiment. Include this hypothesis and your logical reasoning for it as an answer to this question.
Go to the SOME model or click on an existing browser tab where you have the model open. Once the new webpage opens click on the Exp#5. Smooth LANDSCAPE, HIGH INFORMATION, LUAB On button and then the SETUP button. When you are ready, click the GO button and the model will run. Run the model 10-20 times and record the amount of sprawl at the end of each model run. Calculate the average and standard deviation for comparison with the other experiments.
Question 13. Describe why you think the model behaved as you hypothesized or behaved differently from your hypothesis in Question 12.
Question 14. Compare and contrast this model behavior to the previous experiments. Describe the differences or similarities among the experiments using the mean and standard deviation in the number of settlements beyond the growth boundary, the landscape patterns, and the shape of the graph.
Additional Questions
If you download the model and run it in NetLogo then you can add a couple lines of code to get NetLogo to create output files of the spatial pattern. You could then measure those patterns and compare them using landscape pattern indicies (LPIs), which are also sometimes referred to as landscape metrics. What would this enable you to do that you can't do visually?
What is a random seed, how could it be used in the SOME model, and why would it be useful to record a random seed?
You could run a regression on your results and model parameters with your dependent variable being the amount of sprawl and your independent variables being the parameter values. If you applied this to all the data you created from the experiments above, what would it tell you?
Experiment 5 asks you to make a hypothesis about the model outcome before running the model. This challenges the model user to think critically about the model and their conceptual understanding of the system being modelled. For me, I find it useful in that 1) when the model acts as I hypothesized I typically don't believe I can be correct about these sorts of things and it forces me to interrogate the model further to be sure the outcome is correct (e.g., there are no coding errors, incorrectly set parameters, other modelling artifacts), and 2) if my hypothesis is incorrect then I get worked up because I was wrong and find myself driven to figure out why I was wrong. Either way, I end up double and triple checking everything, which makes for a robust outcome. This story highlights an important question, can you use this type of model for predictive purposes? Discuss why this model can or should be used for predictive purposes or why it should not.
Remember that all residential agents have the same parameter values in this model, including preferences for nearness to service centers and high aesthetic quality, which are equally weighted. Since distance and aesthetic quality are equally important to the agents, they will not sacrifice a lengthy distance for higher aesthetic quality. The Space-Quality-Tradeoff slider alters the relative importance residents place on distance to a service center versus aesthetic quality of a location.One thing we did not do, and should often be a first step is to set a parameter like this to the extreme values and ensure that the model behaves as you would expect. So if you set the Space-Quality-Tradeoff to zero what happens and what happens when you set it to two? Did the model perform as you expected?
Think about the factors driving your preferences for a good location to settle at or why you like some places more than others. What other drivers of residential location are essential and missing from this model and the papers that expand on this model? How would you collect data to empirically inform and justify the inclusion of these additional drivers.