![]() In a previous post I outlined our recent acquisition of Aeryon Labs SkyRanger for UAV related research. Andrei Balulescu suggested I check out FugroViewer as a freely available piece of software provided by Fugro to visualize point cloud data. In only a few minutes I could load our training data and render or classify the points by elevation, different returns, pointIDs, point intensity, among other options. Contours and the creation of a TIN model were quick clicks from the toolbar. Also viewing and maneuvering through the points in 3D was also quite quick and easy. Here I’ve rendered the data using a blue (low elevation) to red (high elevation) colour ramp.
In a previous post I outlined our recent acquisition of Aeryon Labs SkyRanger for UAV related research. Andrei Balulescu suggested I check out FugroViewer as a freely available piece of software provided by Fugro to visualize point cloud data. In only a few minutes I could load our training data and render or classify the points by elevation, different returns, pointIDs, point intensity, among other options. Contours and the creation of a TIN model were quick clicks from the toolbar. Also viewing and maneuvering through the points in 3D was also quite quick and easy. Here I’ve rendered the data using a blue (low elevation) to red (high elevation) colour ramp.
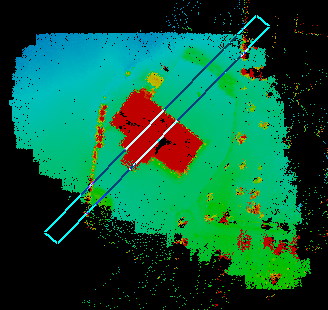
What really caught my eye was the profiling capability of the software. You can establish a transect and specify the width of the transect. The width enhances the number of points accumulated to make the profile view.
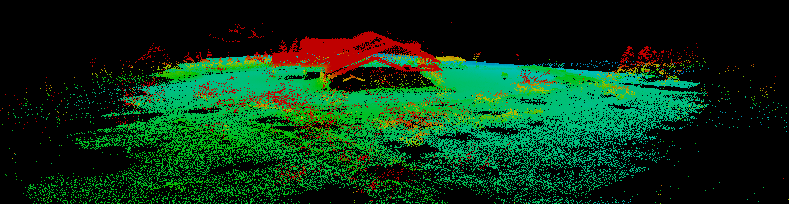
The result is a profile view of the point cloud data. FugroViewer provides two viewing windows and by moving the transect around you can dynamically update the profile view. The image below shows the church from the previous post with a lamp post in front of the church and our car (with trunk open) in the back of the church. Trees flank the property and snow is piled between the car and the trees on the right.