
Pilots – have you ever been flying in the practice area, or maybe passing through it on a cross-country flight, and had to negotiate with other pilots, deviate off course, or even change your plans because there were too many aircraft in the same place? You were experiencing an airborne traffic hotspot, a phenomenon where at a certain location, the density of air traffic is unusually high. Over the Spring 2025 term, I studied the locations and contributing factors for airborne traffic hotspots in the Waterloo Wellington Flight Centre (WWFC) practice area. This post presents some key findings from my research and discusses safe operating practices when hotspots are present.
I came up with the idea for this research project as a result of my involvement, both with the University of Waterloo (as a student in the Geography and Aviation program) and with WWFC (as a Flight Instructor, and previous student). Given that the spring term was my final term of studies, I saw this project as the culmination of my studies at Waterloo – an opportunity to use knowledge from my previous courses to create something new and significant to me. This research project was made possible through the undergraduate course GEOG 475: Independent Study of Selected Topics. In this course, the student works one-on-one with a faculty member to study a topic interesting to them. Having completed my project, I confidently recommend that students pursue a similar project, whether through GEOG 475 or through similar self-directed courses (i.e., individual capstone courses, undergraduate thesis).
The study was split into two methods. First, ArcGIS Pro was used to spatially analyze the hotspots in the WWFC practice area. GPS tracking data from 95 of WWFC’s practice area flights were analyzed for density across the practice area, creating a visual representation of the hotspots. Second, WWFC’s student pilots and flight instructors were surveyed about their perception of the practice area. These data were analyzed with descriptive statistics, creating some interesting results which contributed to the safety recommendations (at the end).
Figure 1: WWFC’s Practice Area Hotspots
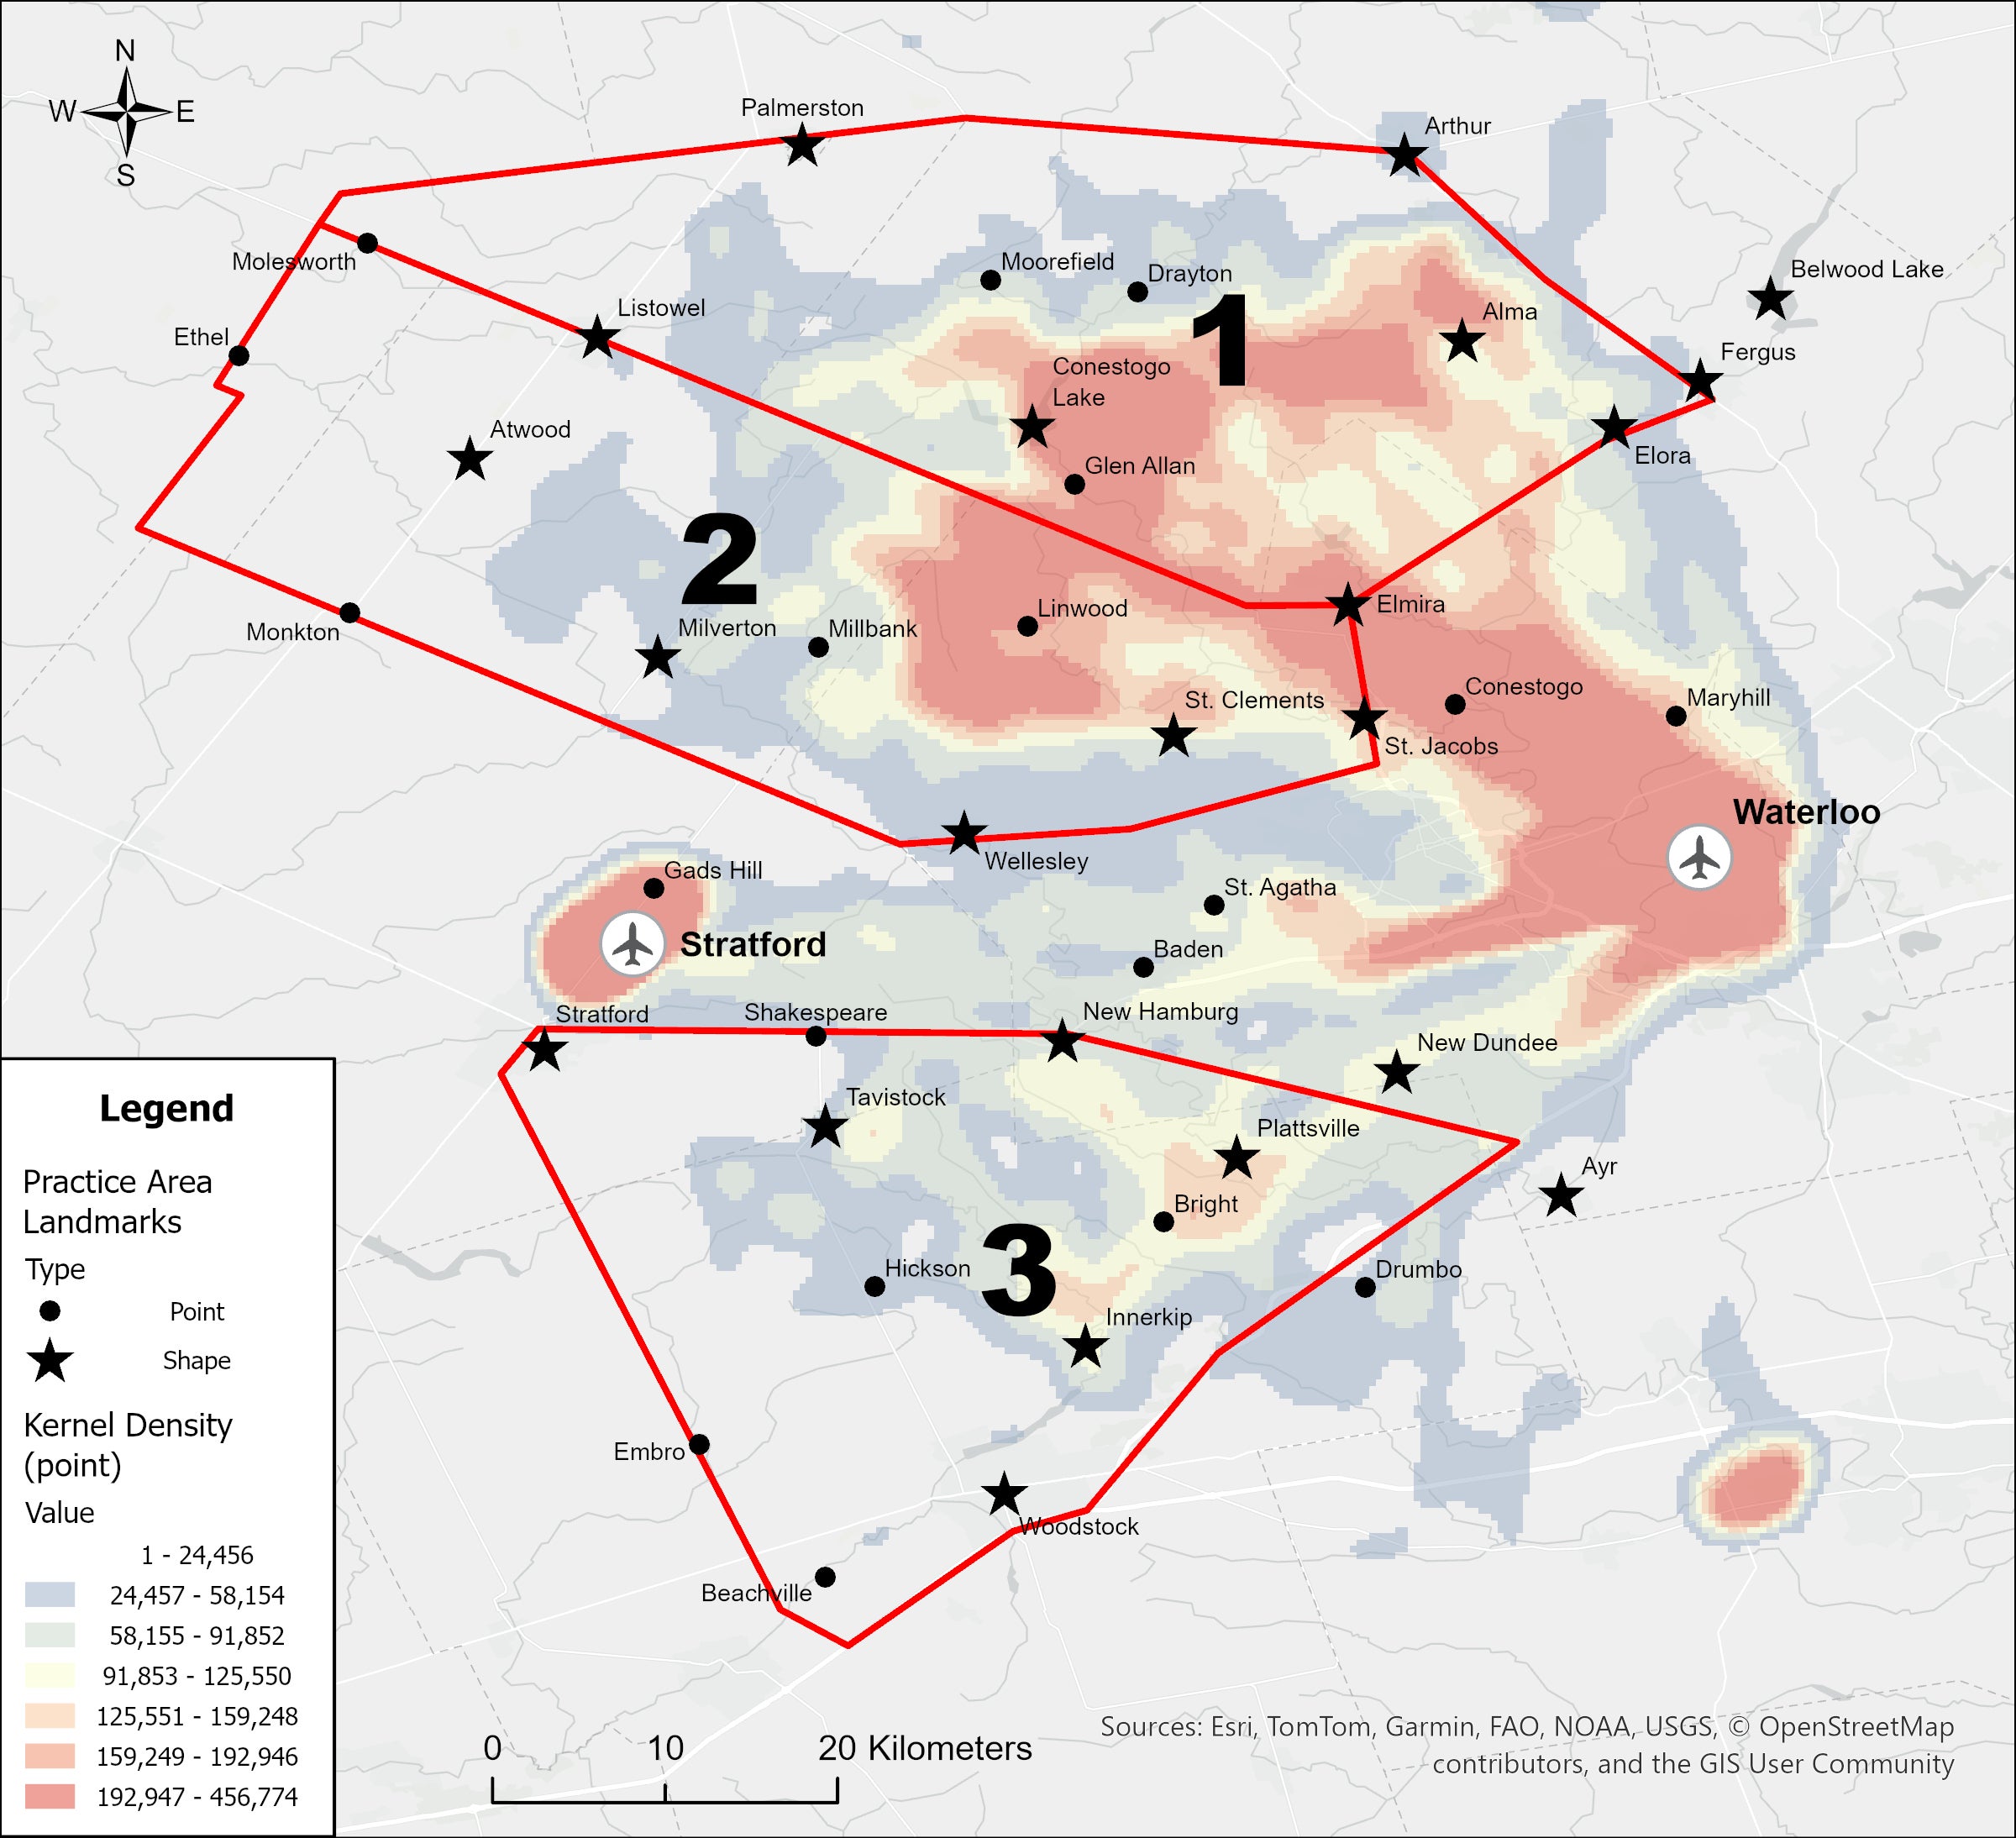
Figure 1 shows the results from the ArcGIS analysis. The greatest severity is shown in red and the least severity in blue. Within the practice area (PA), we can see that most of the red is found in PA 1, suggesting that the most severe hotspots are found in PA 1. This is supported by the fact that nearly half (45.4%) of the cumulative length of the GPS flight tracks is in PA 1.
Specific landmarks that are associated with hotspots are Elmira, Conestogo Lake, Linwood, Maryhill, and Plattsville. Additionally, some hotspots exist along lines – this indicates an exceptionally common flight path. Examples of these linear hotspots start at the Waterloo Airport and end at Elmira, Baden, and New Dundee. Finally, the Waterloo and Stratford Airports are also significant hotspots; however, airports have special procedures to ensure safety at closer proximity, and they are not studied in this research project.
The data used in Figure 1 were collected over a 15-day period in late spring. Therefore, the map is limited, in that it only displays the most typical hotspots. The hotspots on any given day may not be the same as the above map, as they are always changing due to factors that are discussed below in the survey results.
In the survey, respondents were asked to share their opinion on how a hotspot can become severe. Their answers were categorized into topics which are shown below in Table 1.
|
Topic Level 1 |
Topic Level 2 |
Percentage of answers within topic |
|---|---|---|
|
Airport Proximity |
- |
36.6 |
|
Navigation |
- |
18.3 |
|
Navigation |
Within PA |
8.5 |
|
Navigation |
Cross-Country |
8.5 |
|
Flight Instructor Influence |
- |
12.2 |
|
Visibility |
- |
39.0 |
The most popular factors are Visibility and Airport Proximity. This suggests that the most severe hotspots form at a landmark that is easily visible and close to the airport. In the case of Elmira and Conestogo Lake, they are visibly prominent, close to the airport, and close to each other; therefore, they are severe hotspots. Small towns like Monkton and Embro are located on the far edges of the PA, and are less visible, causing them to be less severe hotspots.
Factors change, further complicating predictions of where hotspots may form. For example, on a summer day when visibility is high, even small towns are visibly prominent in the surrounding landscape, giving pilots many landmarks with which to spatially orient themselves. However, on a winter day when snow covers the ground and the visibility is lower, large towns and lakes may be the only landmarks visible from altitude, causing more pilots to fly over them for spatial orientation. Additionally, other factors not mentioned in Figure 2 may also influence hotspot formation. Examples of these are the active runway (which dictates the initial direction of travel) and secondary hotspots (if Elmira is known to be a hotspot, several pilots may divert to the same alternate location, which could create a new “secondary” hotspot).
Respondents were also asked how they maintain safety around PA hotspots. Results from this question are below in Table 2.
|
Topic Level 1 |
Topic Level 2 |
Topic Level 3 |
Percentage of answers within topic |
|---|---|---|---|
|
Avoidance |
- |
- |
57.1 |
|
Avoidance |
Vertical |
- |
32.7 |
|
Avoidance |
Horizontal |
- |
34.7 |
|
Avoidance |
Horizontal |
Edge of PA |
8.2 |
|
Communication |
- |
- |
65.3 |
|
Communication |
Listening Watch |
- |
22.4 |
|
Communication |
Position Reports |
- |
49.0 |
|
Lookout |
- |
- |
18.4 |
The most popular strategies (ignoring Avoidance and Communication, as they are subdivided) are Position Reports, Horizontal Avoidance, and Vertical Avoidance. Listening Watch and Lookout are less popular. These results suggest that respondents prefer more to communicate their position and remain clear of known hotspots, than to scan for traffic and listen for radio calls from other aircraft. However, effective visual scans and a listening watch are essential for safety, and pilots are encouraged to use them more extensively in the practice area.
These results are a small sample from the entire study’s results. They give a quick look into where hotspots occur, how pilots perceive and interact with hotspots, and they enable the creation of safety recommendations for pilots.
To wrap up this blog post, I’ve compiled a list of suggestions informed by the results of this study, to improve the safety of your next flight. Fly safe!
- Familiarize yourself with landmarks that are further from the airport and slightly smaller. These are less likely to become hotspots.
- Frequently scan the sky for conflicting aircraft and listen for radio calls from aircraft in your area, especially close to the airport.
- Avoid common checkpoints when arriving and departing (e.g., Elmira, Baden).
- Remain flexible. Hotspots are always moving, and if you find that numerous aircraft are closing in on your position, either negotiate separation or divert to a different landmark.
Thank you to the Waterloo Wellington Flight Centre for aiding in the recruitment of participants and supplying data for this study, and to Dr. Gülnaz Bülbül for supervising and mentoring me throughout this project.