Locating Noise Sources with a Microphone Array
Noise is one of the main obstacles in the public acceptance of wind turbines. A major source of noise produced by turbines arises from aerodynamic interactions between the turbine blades and the surrounding air. Numerous studies have investigated noise generation due to flow over static airfoil sections. However, few experiments have been able to account for the differences in vortical structures due to rotation of the blades. Additionally, acoustic testing using a microphone in a flow can be challenging as the background noise at the microphone is increased due to self-noise induced by interactions with the wind. Recently, aeroacoustic testing has been improved through the use of microphone arrays, a structured group of microphones. The use of the microphone array improves the signal-to-noise ratio and allows noise sources to be spatially located. The measurement technique as implemented at the university demonstrates some examples of how a microphone array can be used to measure and locate noise.
Array Details

The microphone array is composed of 30 inexpensive, surface mount MEMS microphones. These microphones were low cost, had suitable performance, and built-in amplification. The array is laid out in five spiral arms each containing six microphones. Using this array, experiments were carried out to measure the ability of the array to locate a stationary and moving sound source 1 m away.
Results

The MEMS microphone array sucessfully measured the known sound sources. The array identified multiple sound sources at the same frequency, for relatively small differences in amplitude between sources. Multiple sources emitting simultaneously at different frequencies were identified. Moving sources were accurately measured and located.
Results of wind turbine measurements
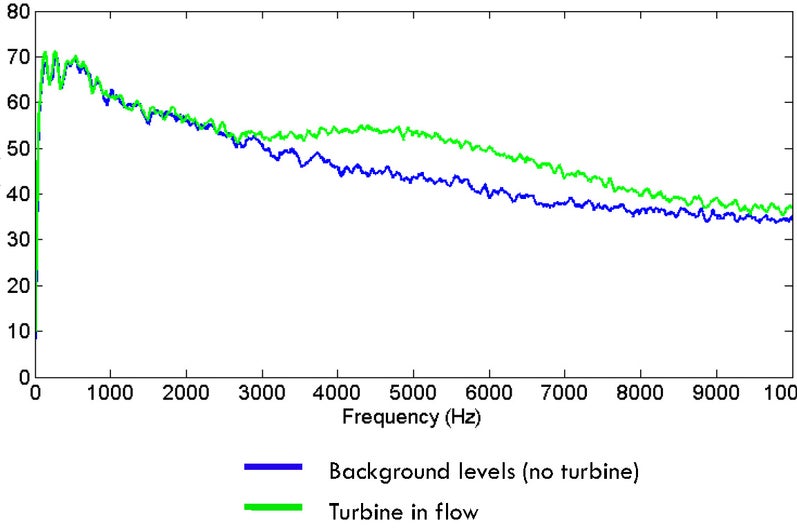
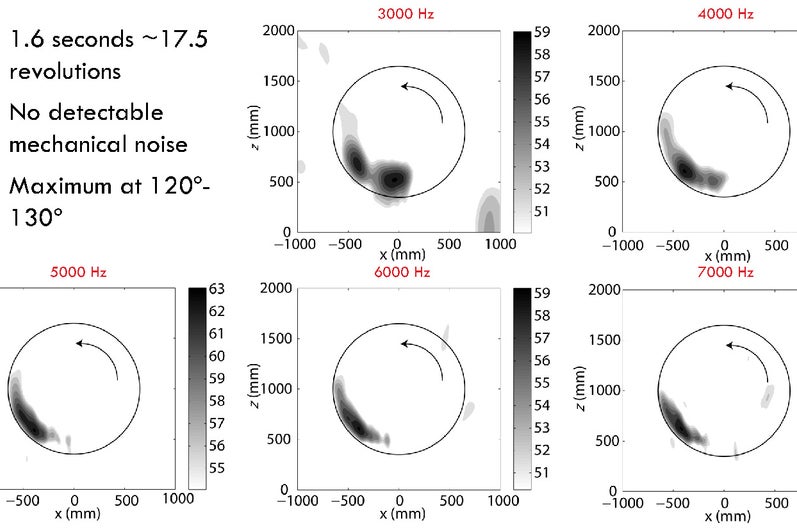
Here are some examples of measurements using the array with a small wind turbine that is rotating and in operation. The first figure is the sound pressure level with and without the turbine present showing the increase in SPL with the turbine operating. The second figure shows the usefulness of the array in determining the exact location of the noise source for several specific frequencies (3-7 kHz). The circles in the figure show the diameter of the turbine and the grey scale is SPL. For further details see a paper of our research in Wind Engineering journal (2013).
Future Work
Construct a physically larger array with low frequency resolution and improved source identifcation at greater distances for use with our larger full-scale wind turbine


