WiCS has gathered historical and current statistics about the representation of women and other underrepresented gender identities in computer science, in order to understand the current status of gender minorities in computing and to identify trends.
Everyone is always interested in the current statistics. But we encourage you to look also at the historical data, which suggests that the “natural” ratio of other genders in computing ought to be much higher than it currently is. And we encourage you to look at the worldwide data, which suggests that the underrepresentation of other genders in computing in North America might be due to cultural issues rather than to innate aptitudes or interests of these gender minorities.
Undergraduate Admissions/Enrolment (at Waterloo)
Here is information about the representation of self-declared women in all four of Waterloo’s computer-science degree programs (including Computer Science, Computing and Finance Management, Software Engineering, and the Business/Computer Science double degree program).
Fall enrolment data are not official until November of each year. Preliminary information about Fall 2025 admissions to Waterloo’s undergraduate CS programs indicates that
- Computer Science has admitted 95 self-declared women (23.1%)
- Computing and Finance Management has admitted 11 self-declared women (18.6%)
- Software Engineering has admitted 24 self-declared women (16.4%)
- Business/Computer Science double degree program has admitted 10 self-declared women (27%)
- IN TOTAL Waterloo’s CS programs have admitted 140 self-declared women (21.4%)
The percentage of self-declared women admitted into our various programs fluctuates a lot each year, especially in the smaller programs, but as you can see from the chart below the total representation of self-declared women in admittance (represented by the black line below) has been steadily increasing before dropping in Fall 2025.
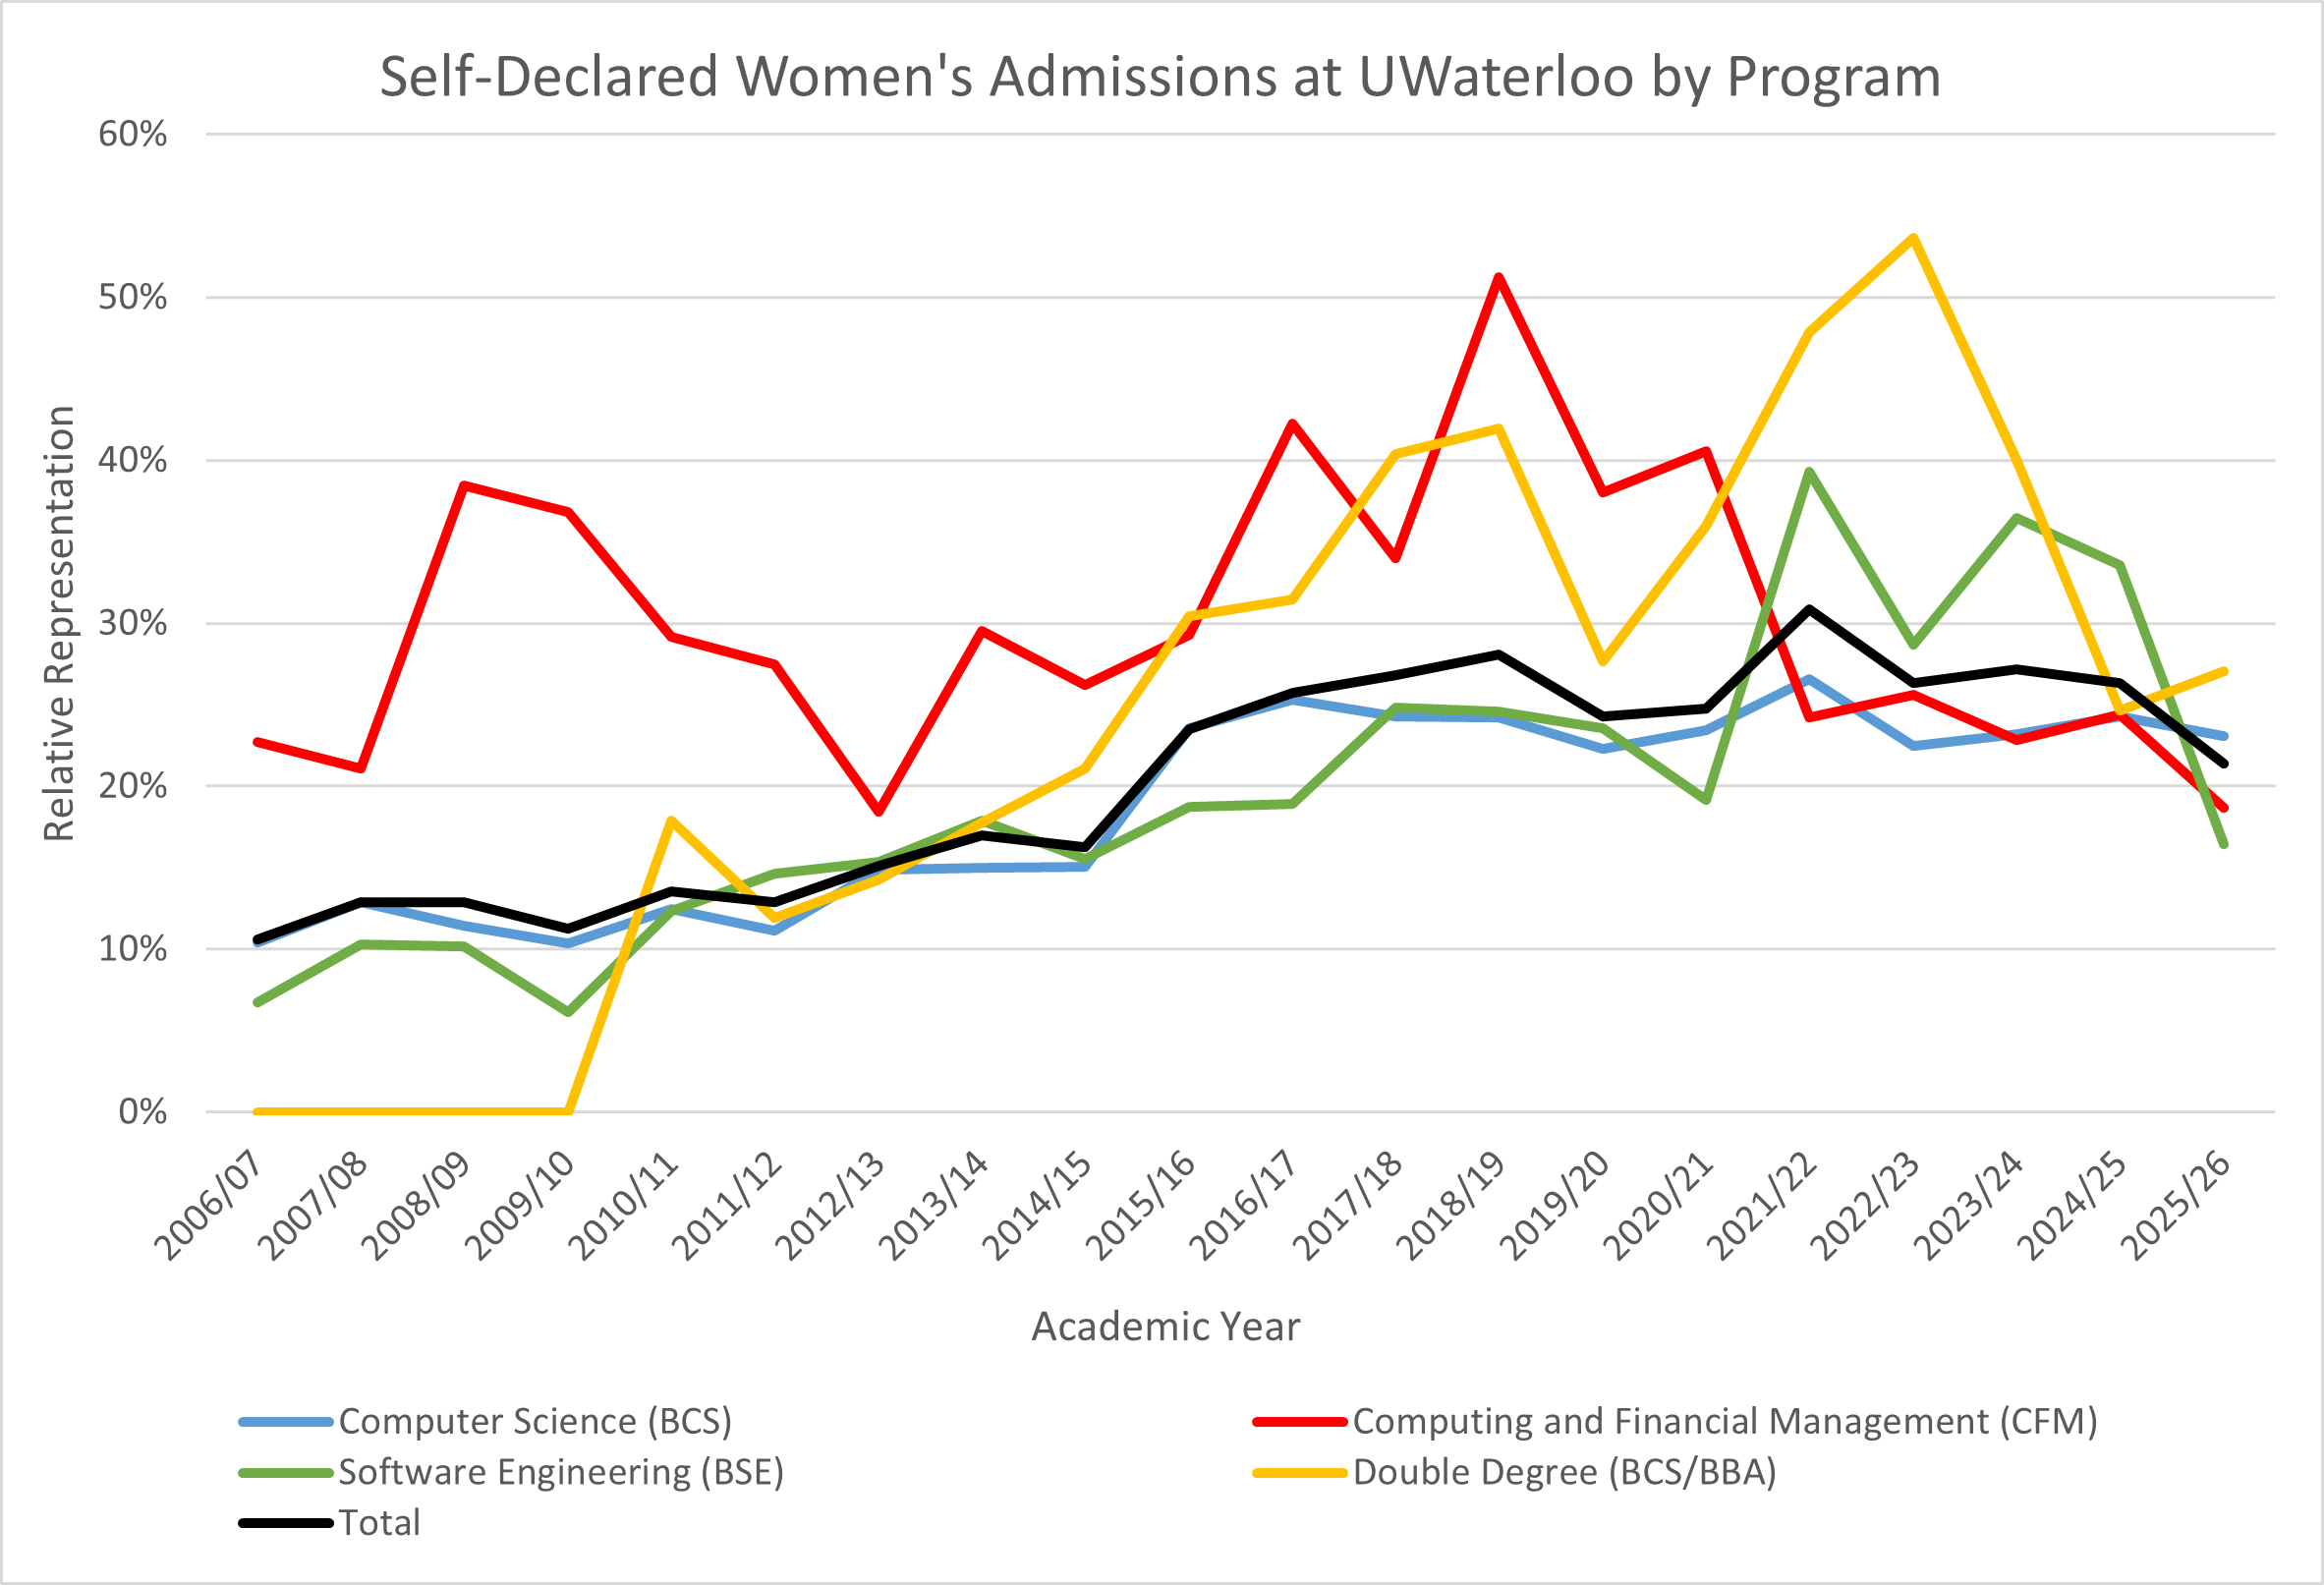
The number of self-declared women admitted each year has also been going up. In recent years, Waterloo has been admitting roughly 150-180 self-declared women students into its CS programs each fall. (Fall 2020 was an anomaly because of COVID). The most recent drop in admissions for Fall 2025 stresses how EDI-R is an ongoing process that requires constant speaking up.

Increases in the percentage of self-declared women admitted to our CS programs each year have led to overall increases in the enrolment of self-declared women in CS at Waterloo over the last several years. Moreover, the percentage of self-declared women among students who transfer into CS from Math is typically higher than the percentage of self-declared women who are admitted to CS directly from high school. The internal transfers of self-declared women in CS are typically made by students who took no computer science in high school, applied to Waterloo Math, discovered computing when they took CS 115 or CS 135 in their first year, realized they were good at it and decided then to apply to transfer to CS.
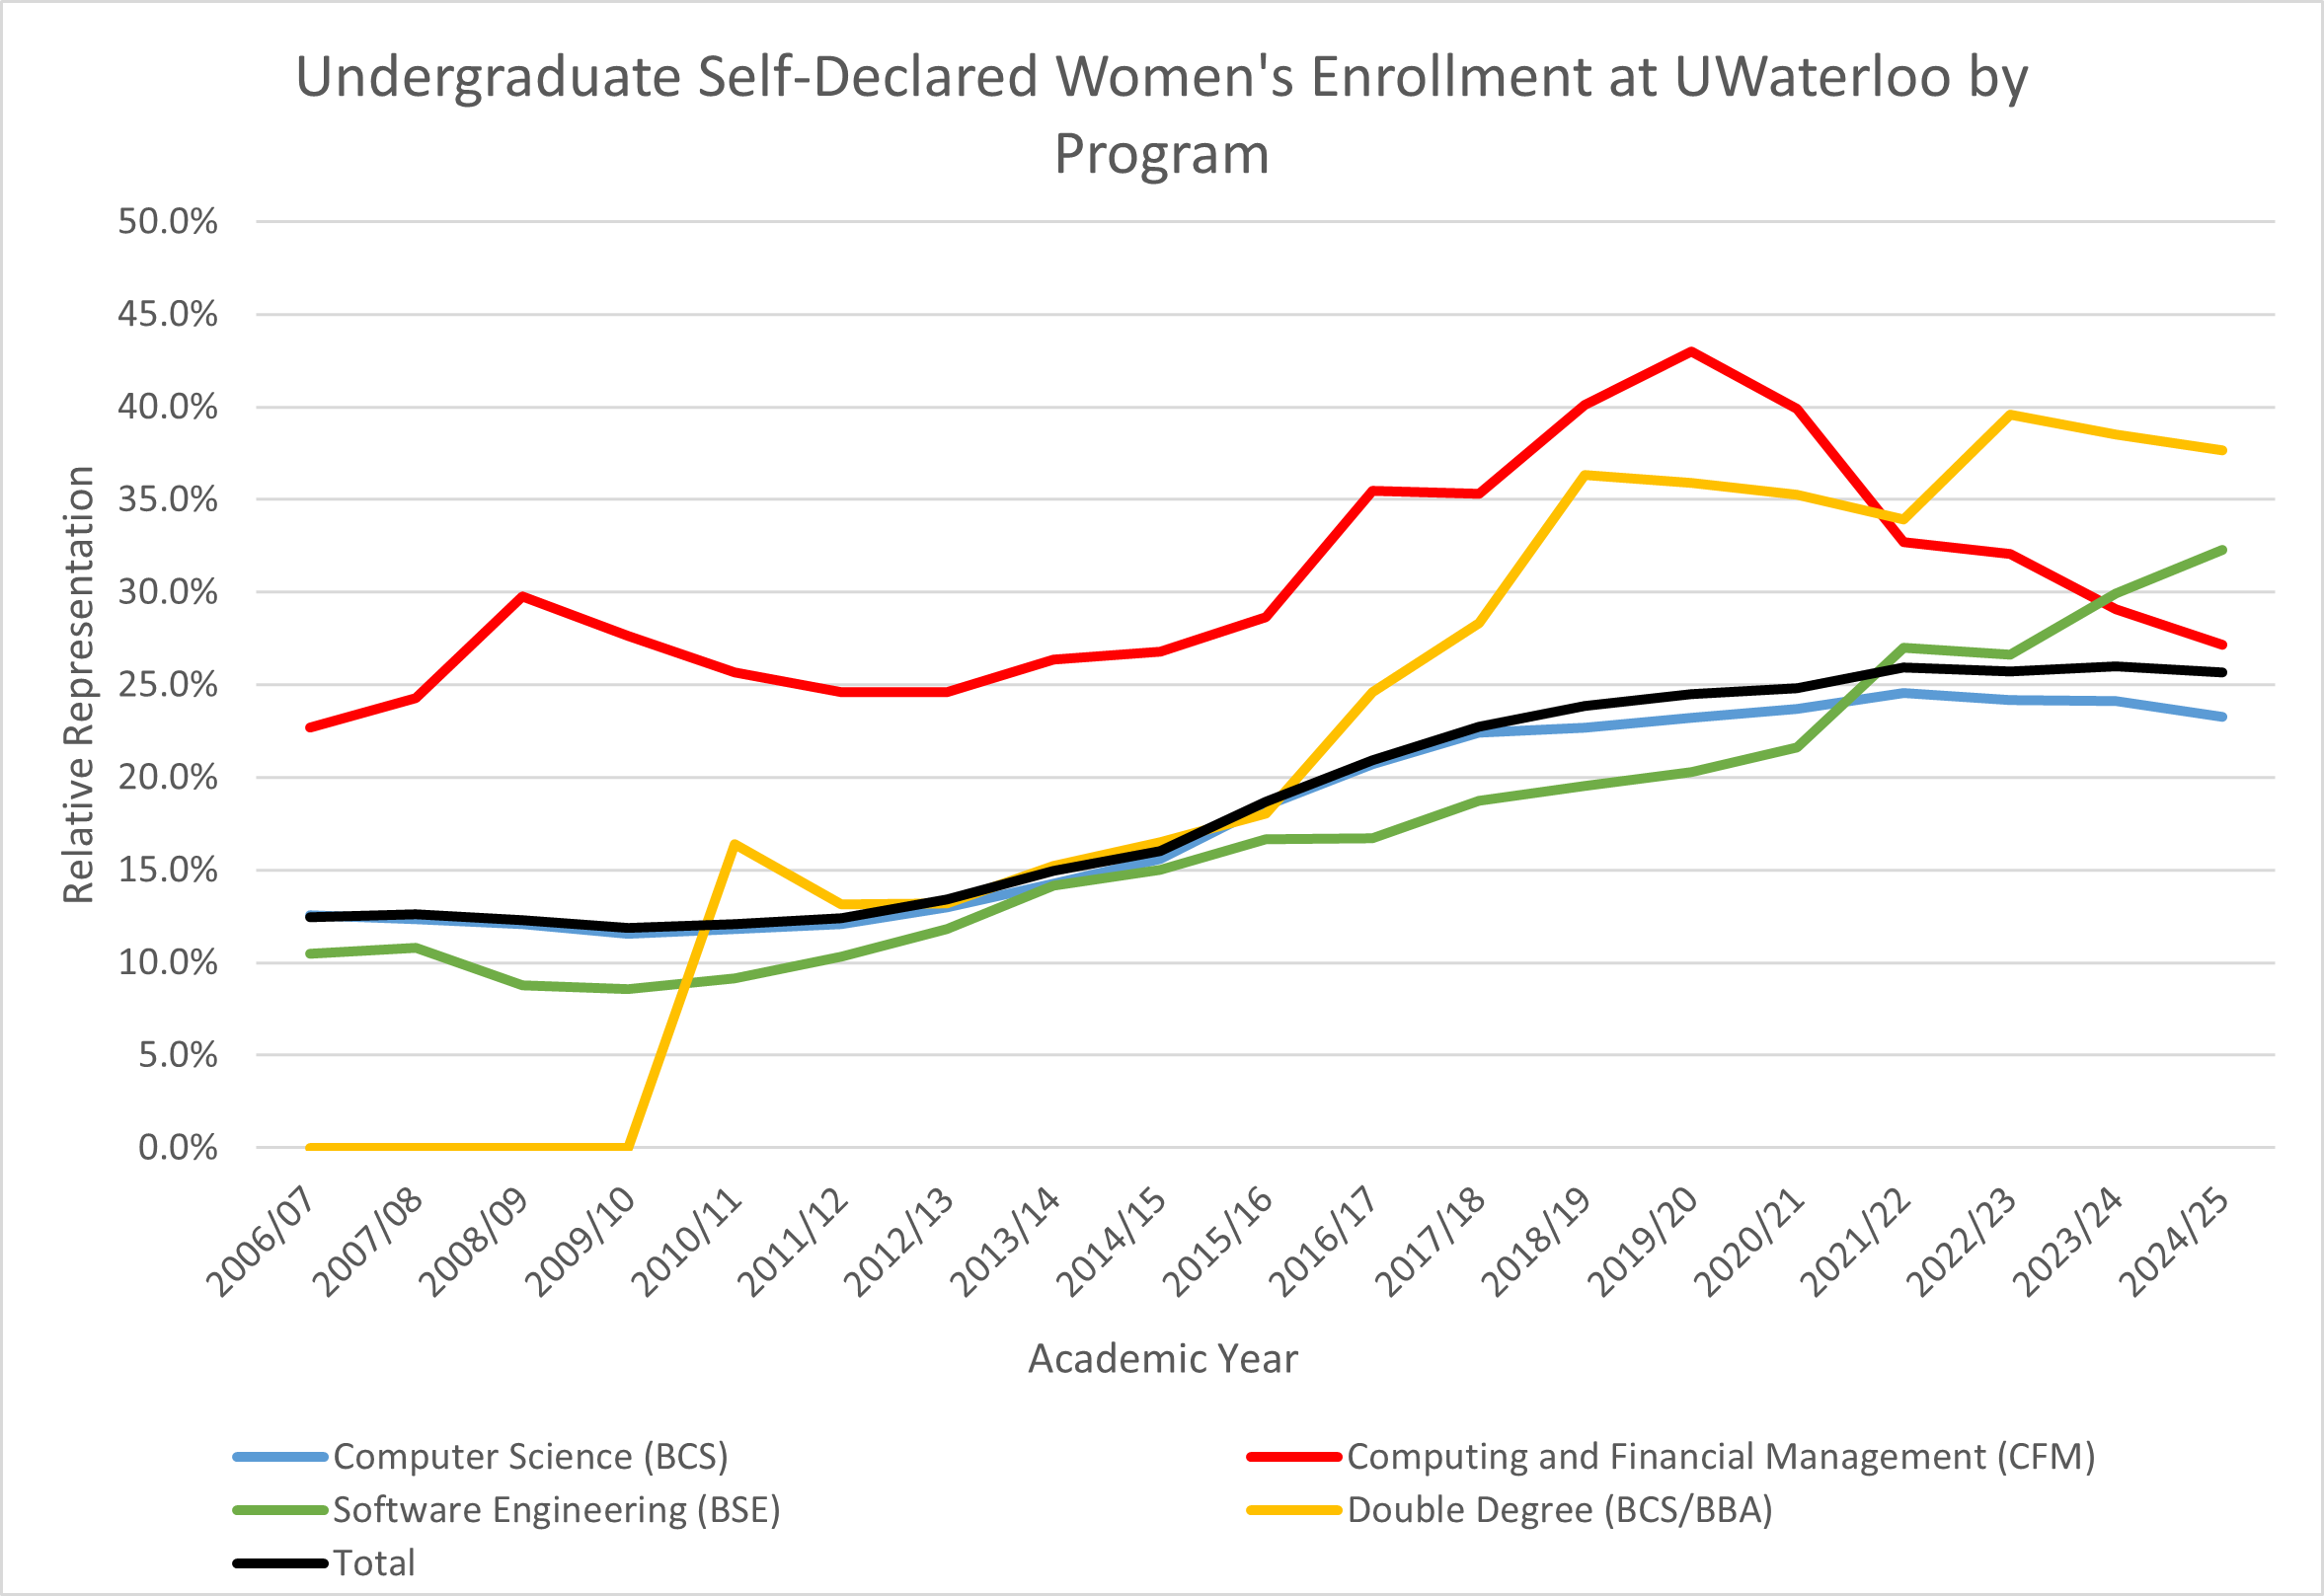
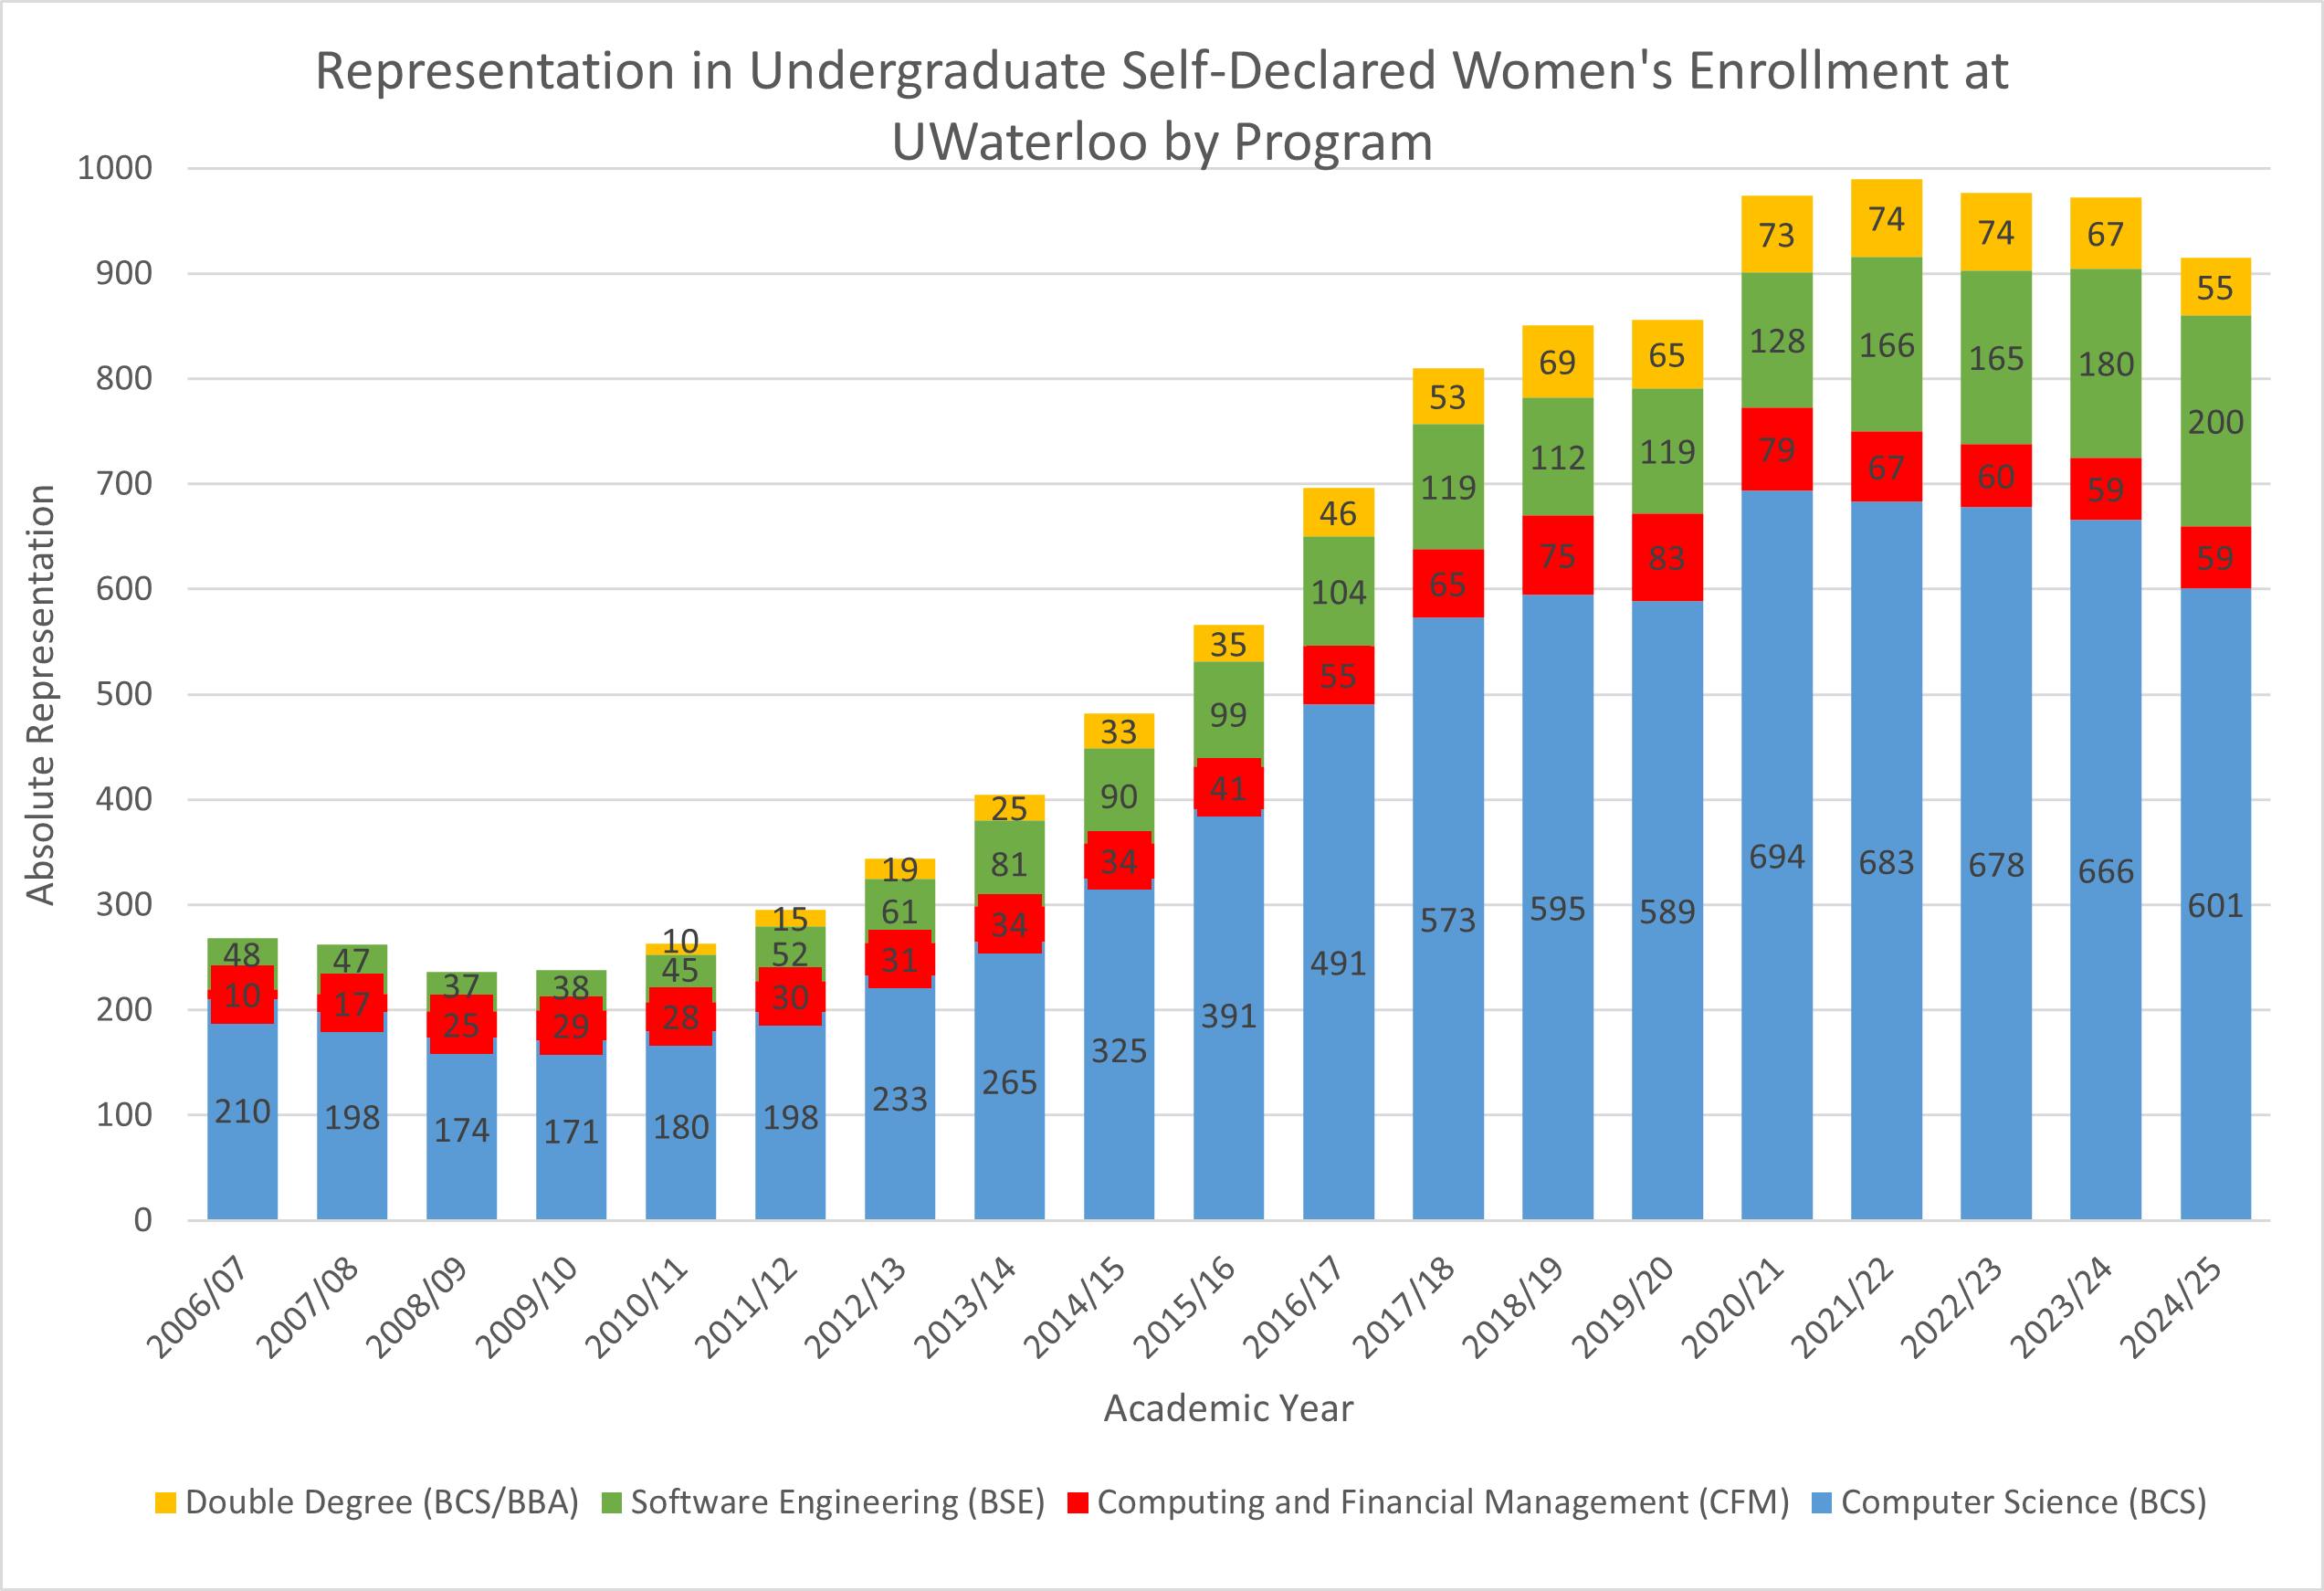
These days, the total number of self-declared women enrolled in our various CS programs hovers under 1000.
References: Institutional Analysis & Planning, University of Waterloo
Graduate Enrolment (at Waterloo)
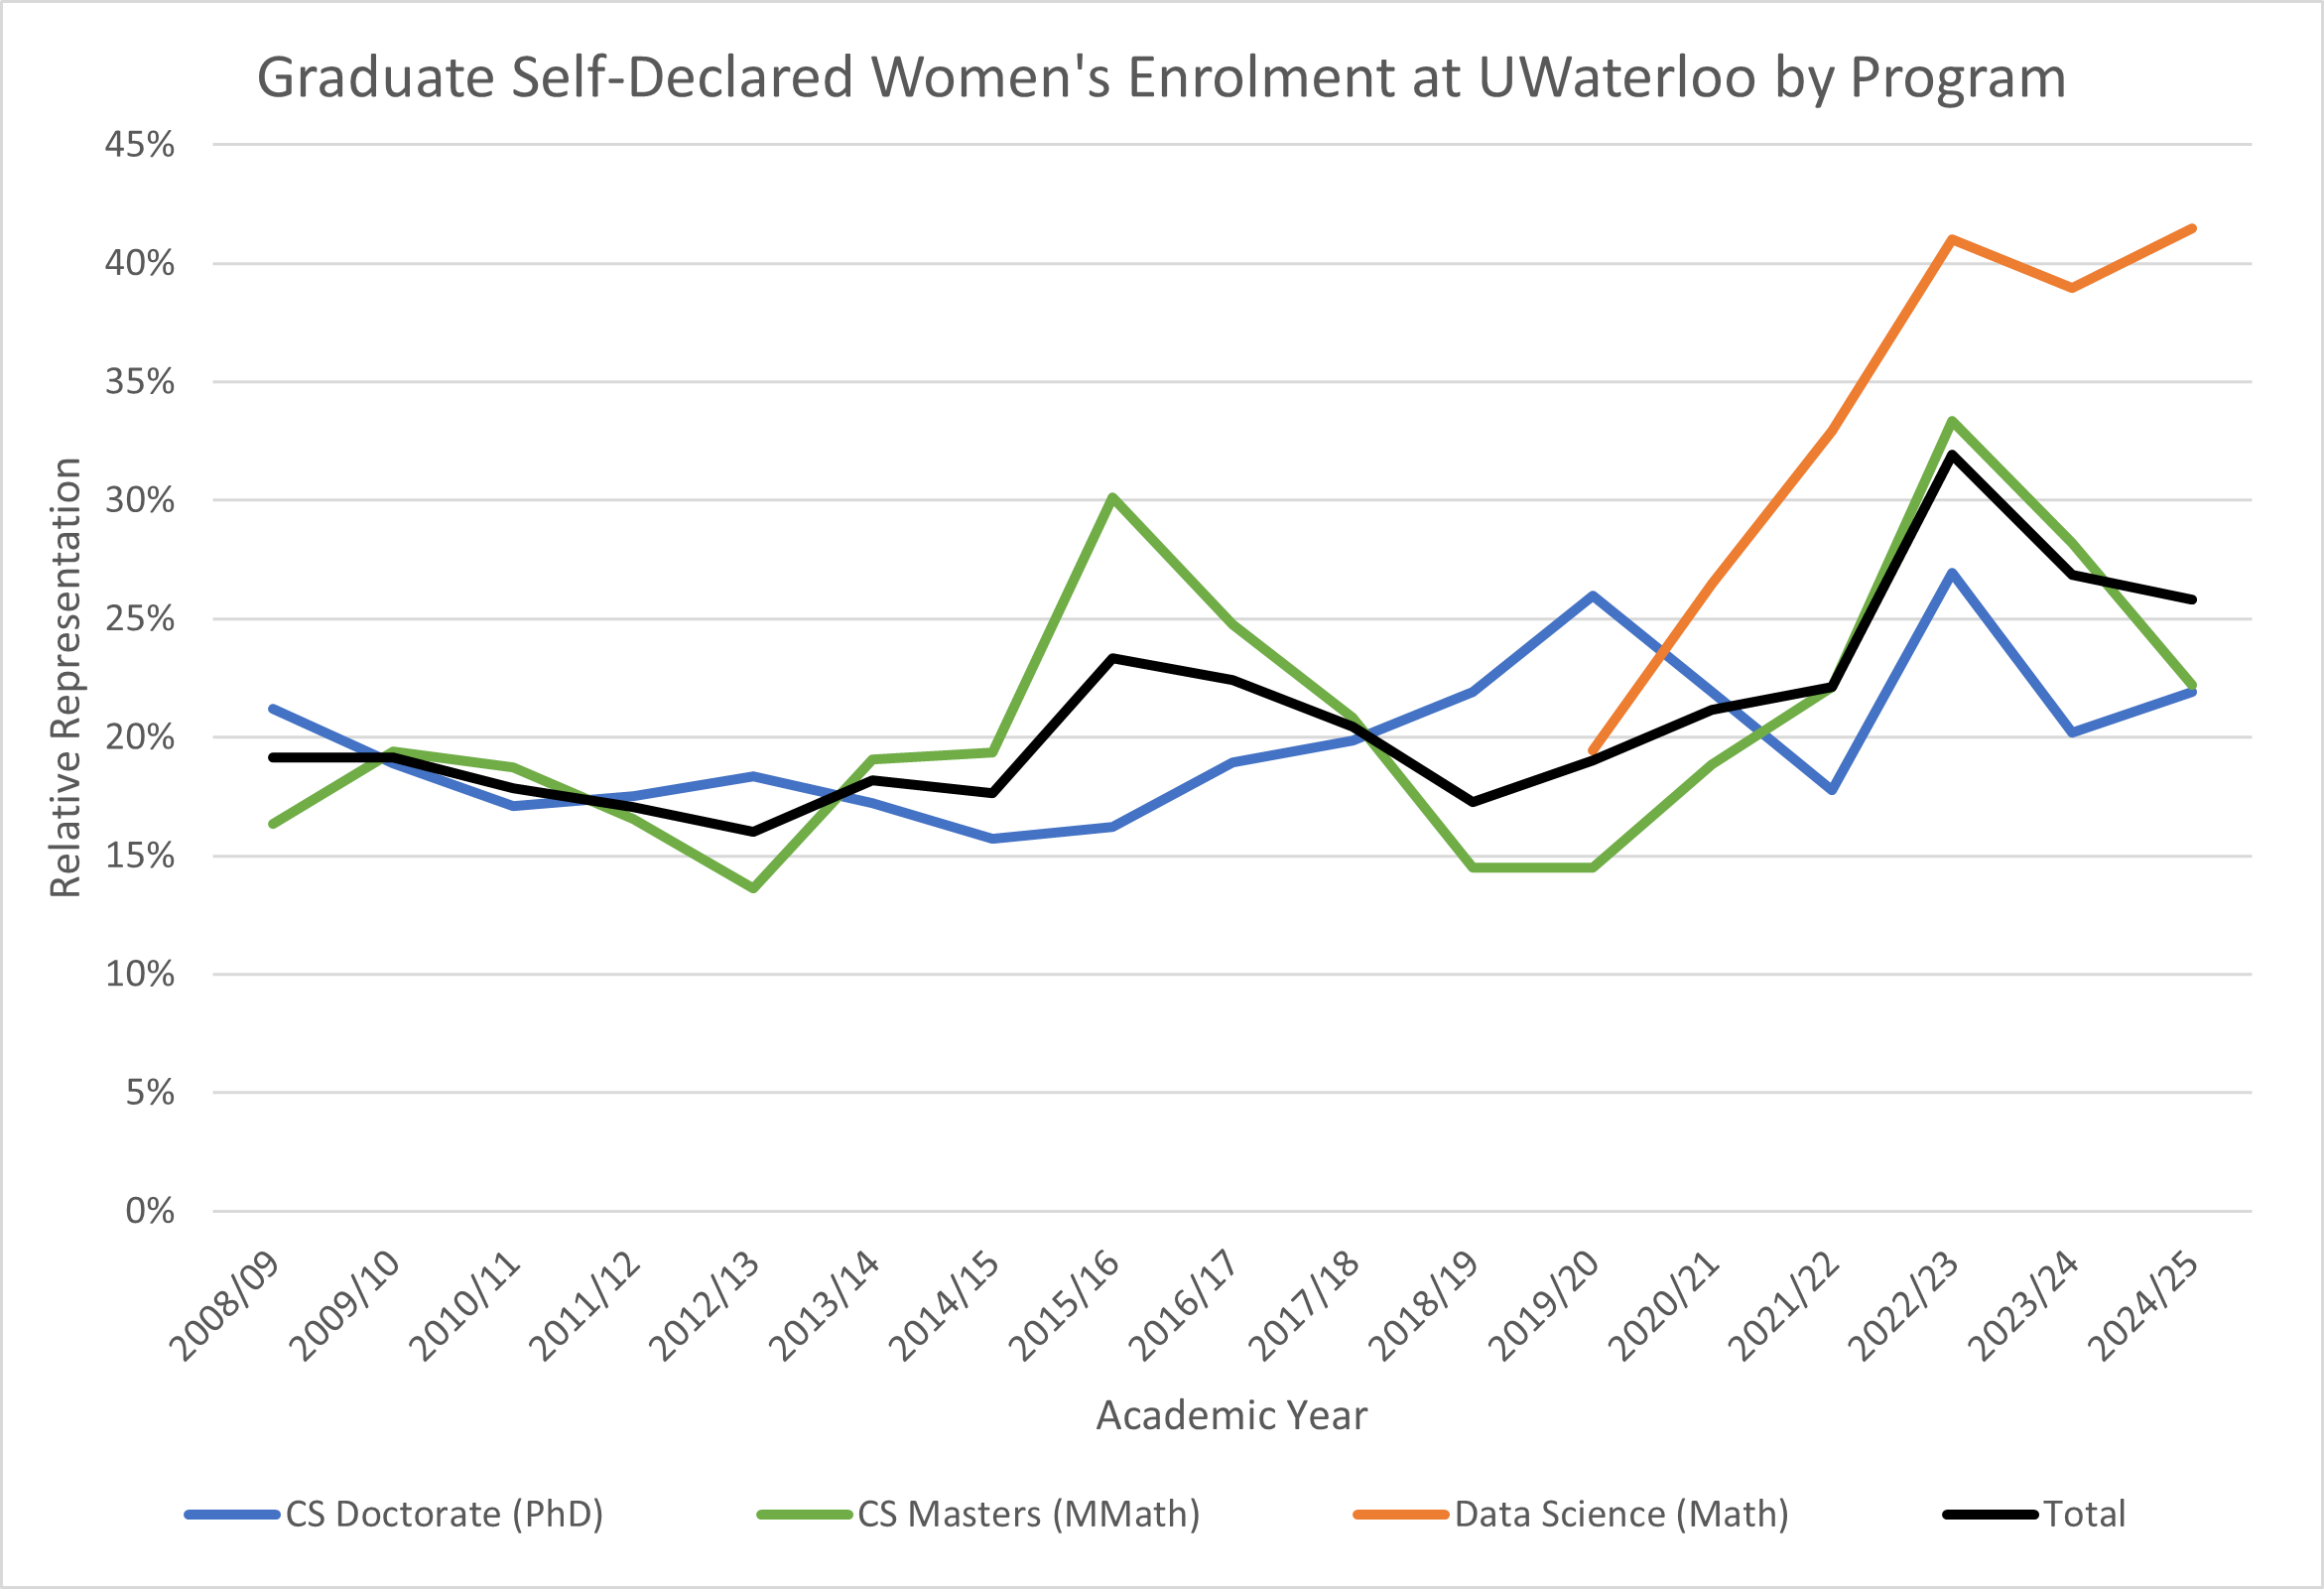
The total percentage of self-declared women in our CS graduate programs has remained relatively stable. As the number of students in our graduate programs has increased, the number of self-declared women students has increased proportionally, and the increase in numbers helps to create a larger community of more than 100 self-declared women graduate students. Recently the overall stable representation increased due to large increases in representation in data science graduate studies.

WiCS graduate students run welcome events for new students and organize joint social events and discussions with other affinity groups, such as Women in Mathematics (WIM), Women in Engineering (WIE), and FemPhys.
References: Institutional Analysis & Planning, University of Waterloo
Women Faculty (at Waterloo)
Undergraduate Enrolment (in Canada)
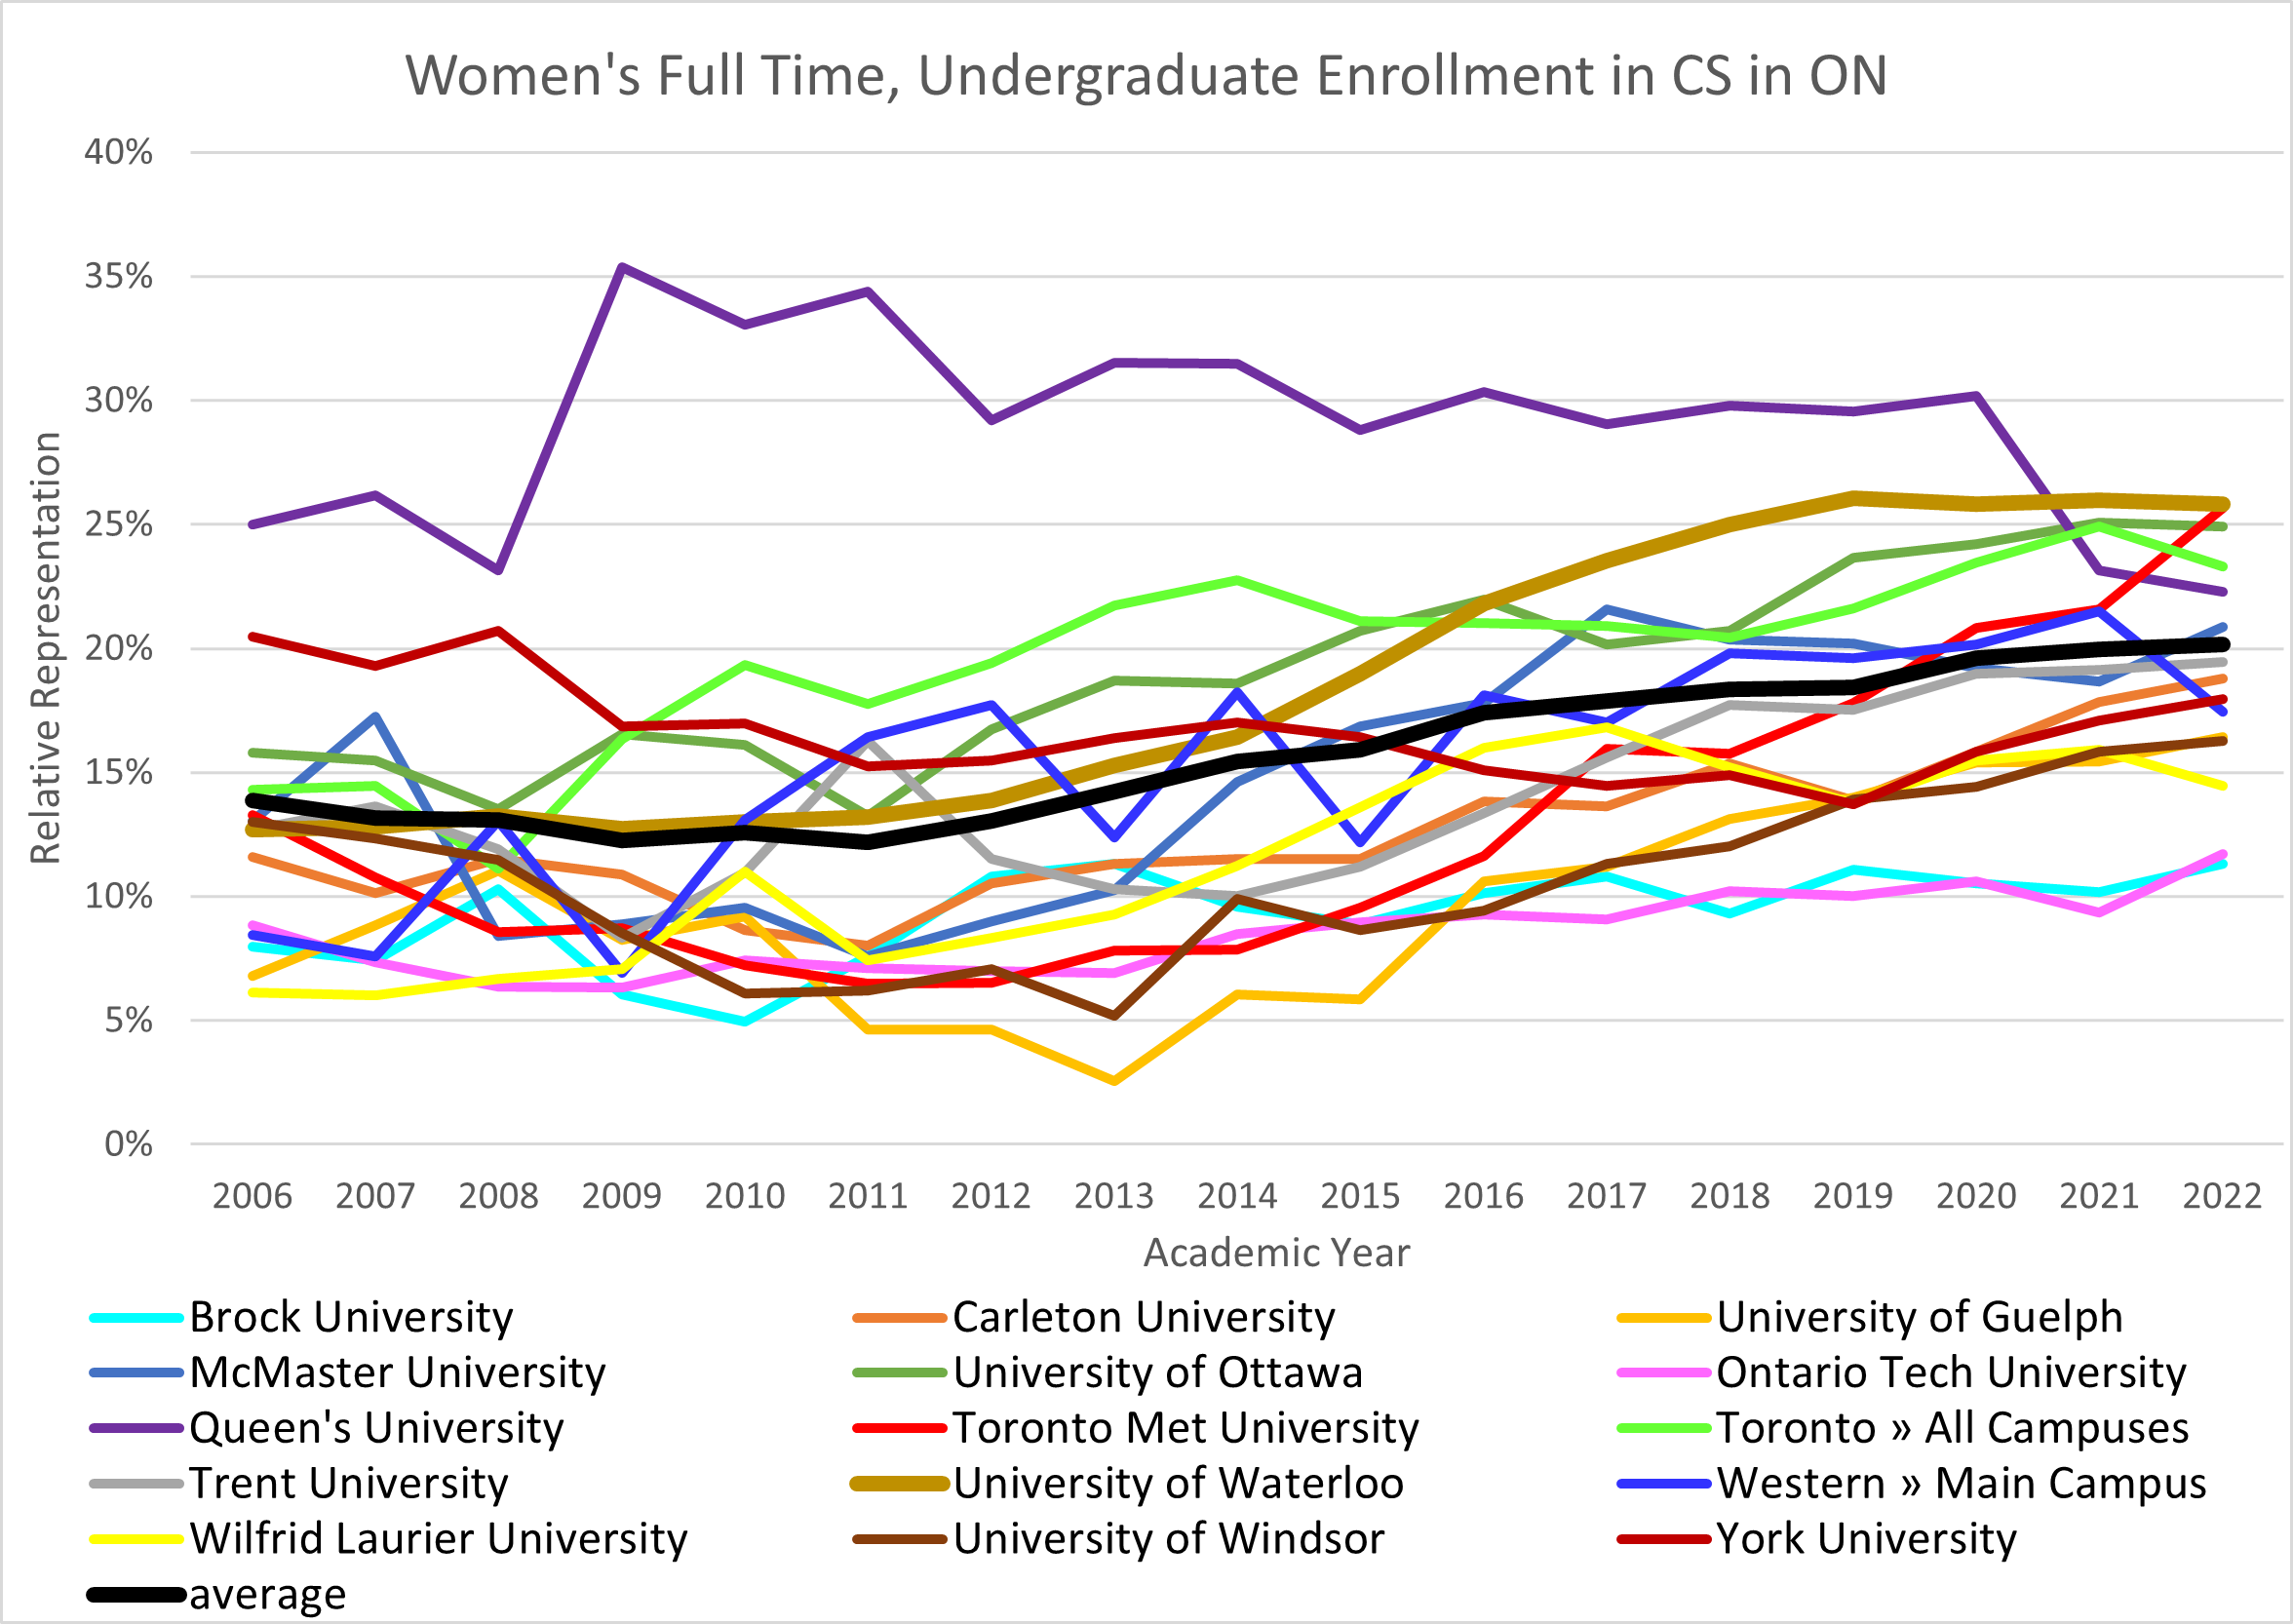
The graph below shows the most recent statistics on the enrollment of self declared women in undergraduate programs in computer science at 15 universities across Canada. The black line is the average enrollment of women among the 15 institutions (based on the numbers of women and men enrolled in CS at those institutions).
There are several takeaways from these statistics.
- The representation of women in undergraduate computer science is increasing nationally – slowly, but steadily.
- The representation of women in undergraduate computer science varies wildly by institution.
Waterloo is the gold line on the graph. As you can see, the representation of women in computing at Waterloo has been rising above average for several years. Waterloo is at a bit of a disadvantage in attracting women students into its CS programs because most of its CS students are admitted directly from high school; but many high-school women have little experience with computing and are hesitant to apply to a degree program if they know little about the discipline.
You can also see from the graph that the representation of women in computing at Waterloo has been growing at above-average rates – in part due to the initiatives and community-building of WiCS.
References: Common University Data Ontario
Graduate Enrolment (In Canada)
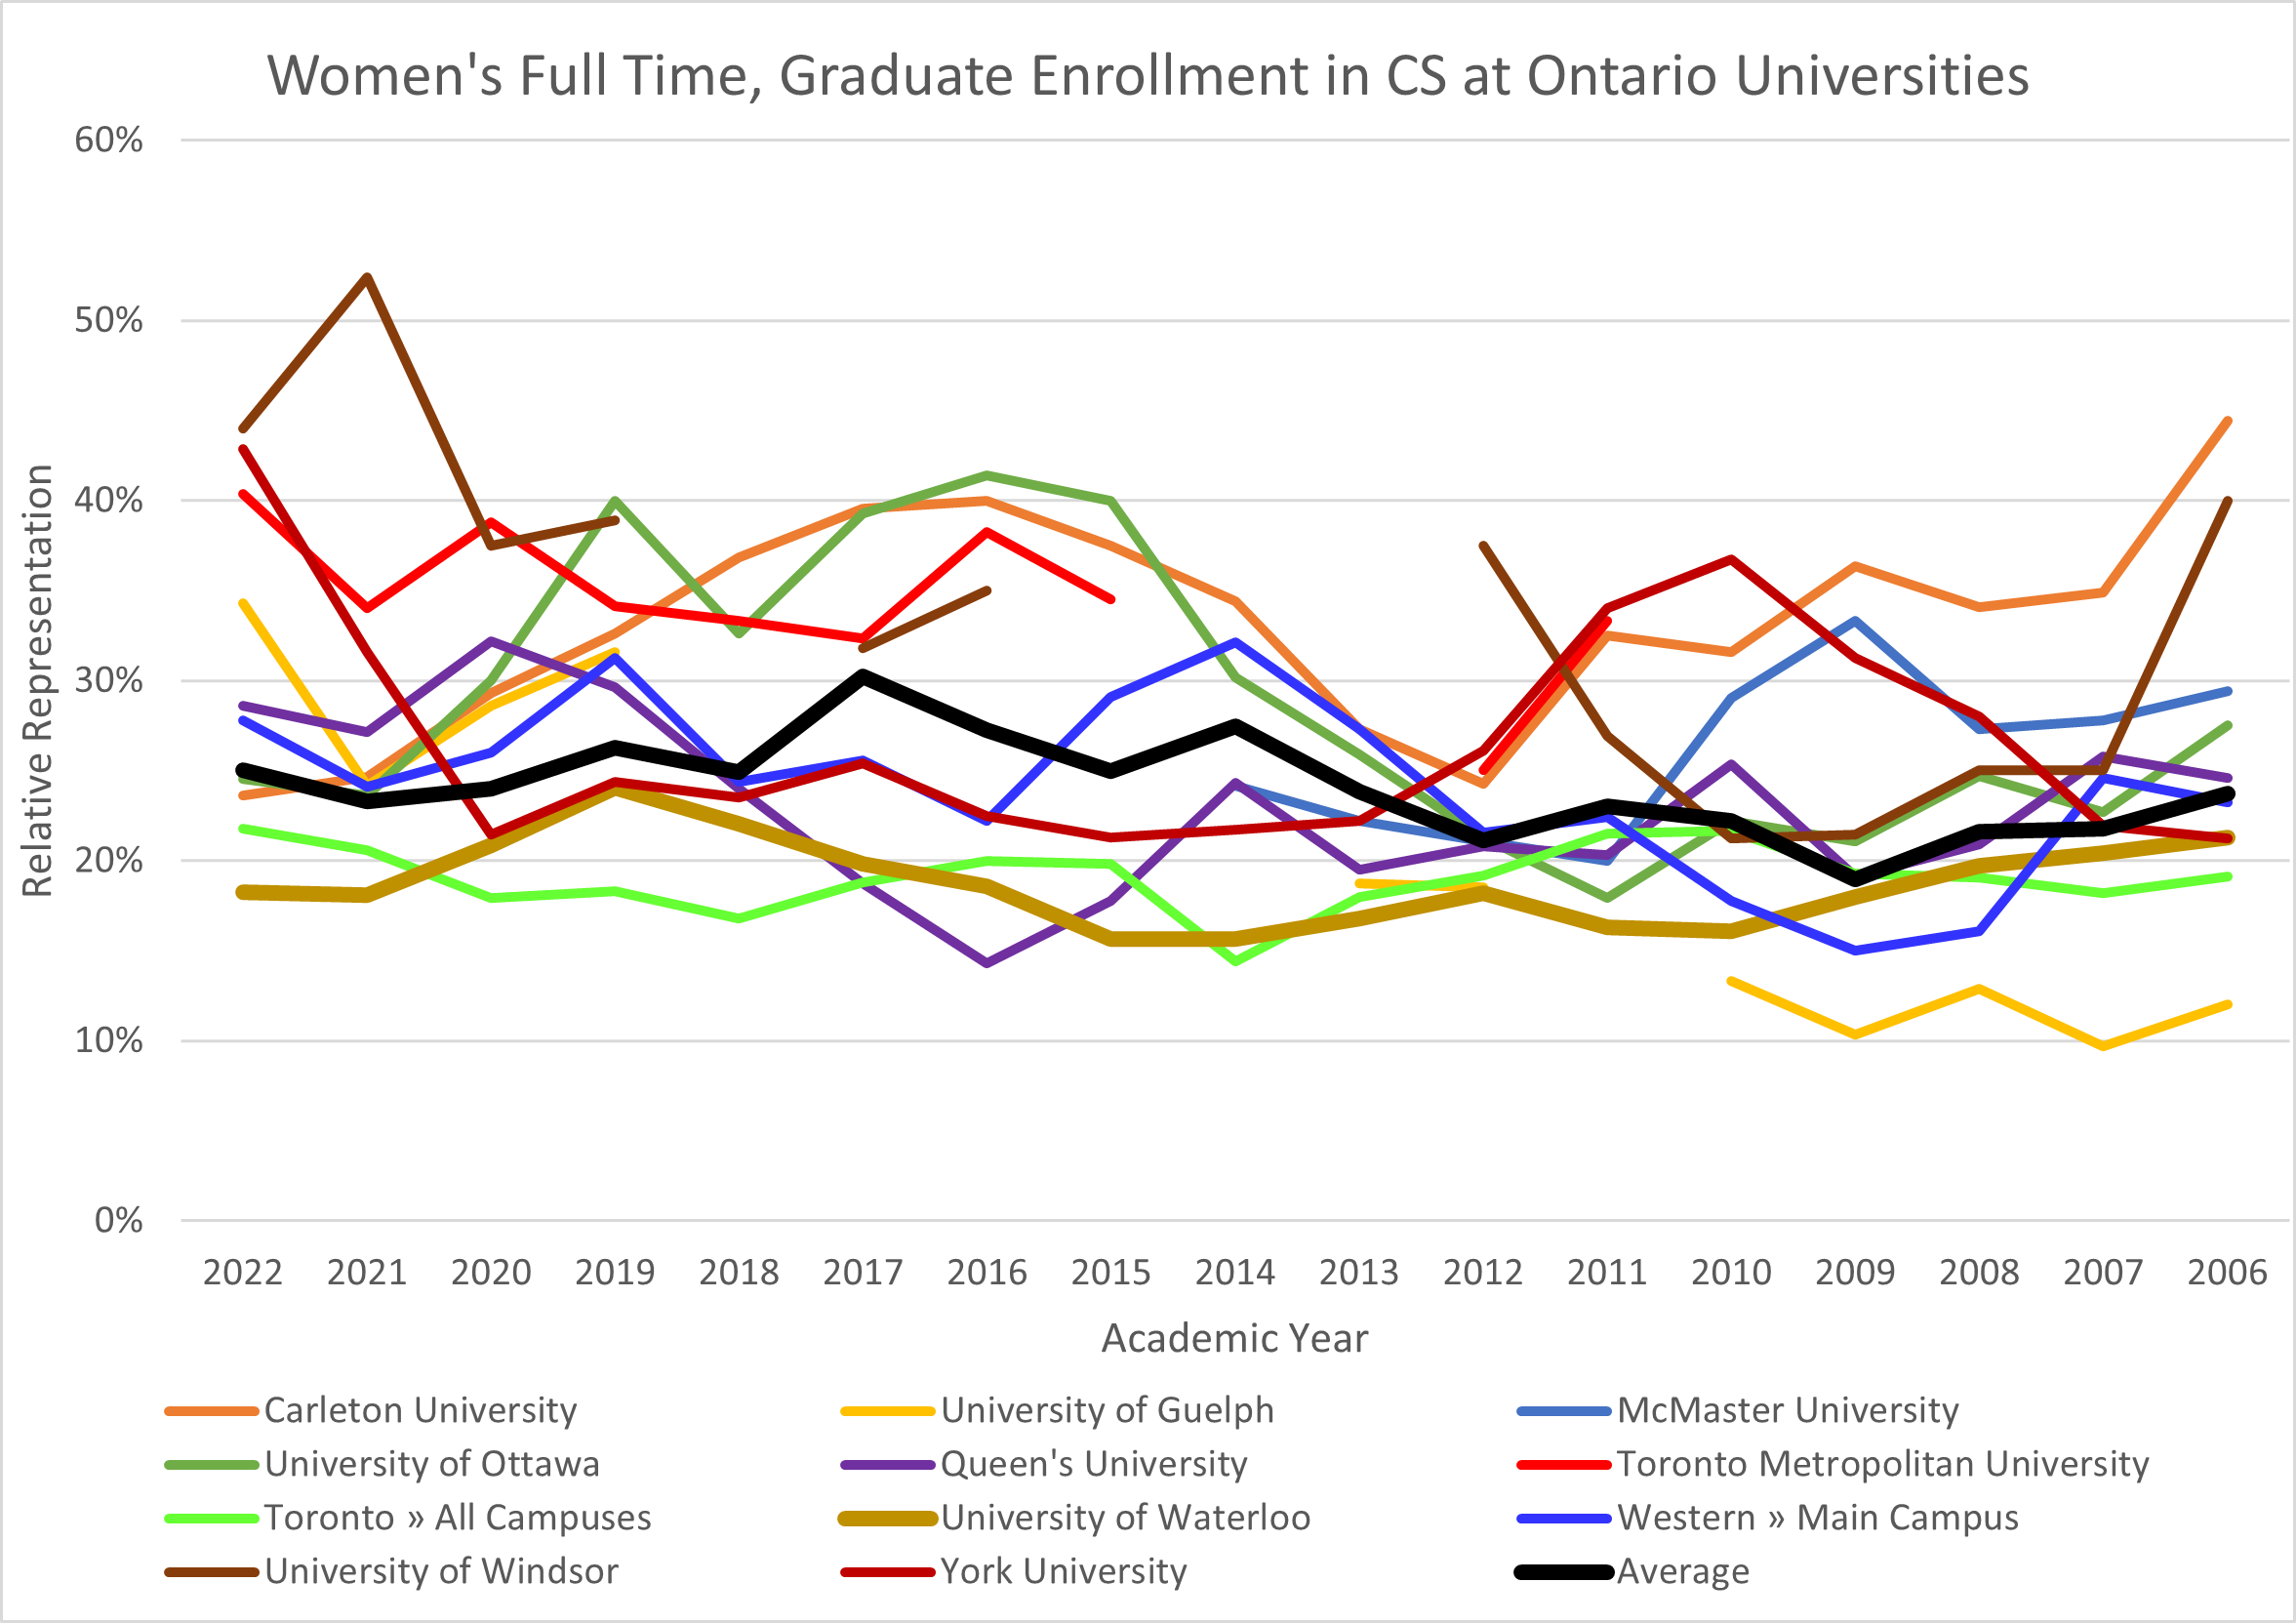
Below is a chart showing the representation of self-declared women in graduate CS programs at 11 universities across Canada. It is difficult to identify enrolment trends in graduate studies because graduate programs are relatively small, and sometimes aren't offered, thus even small changes in the number of women may lead to large swings in the percentage of women in any individual program. The percentage of graduate student women in CS at any university varies quite a bit; but the overall average of women in CS graduate projects across Canada has been levelling off – despite the increased demand for technical women in industry.
References: Common University Data Ontario
Undergraduate Enrolment (CS vs. STEM)
One of the more interesting sets of data shows the rise and fall of the representation of women graduating from university degree programs in computing in the US over the last 50 years.
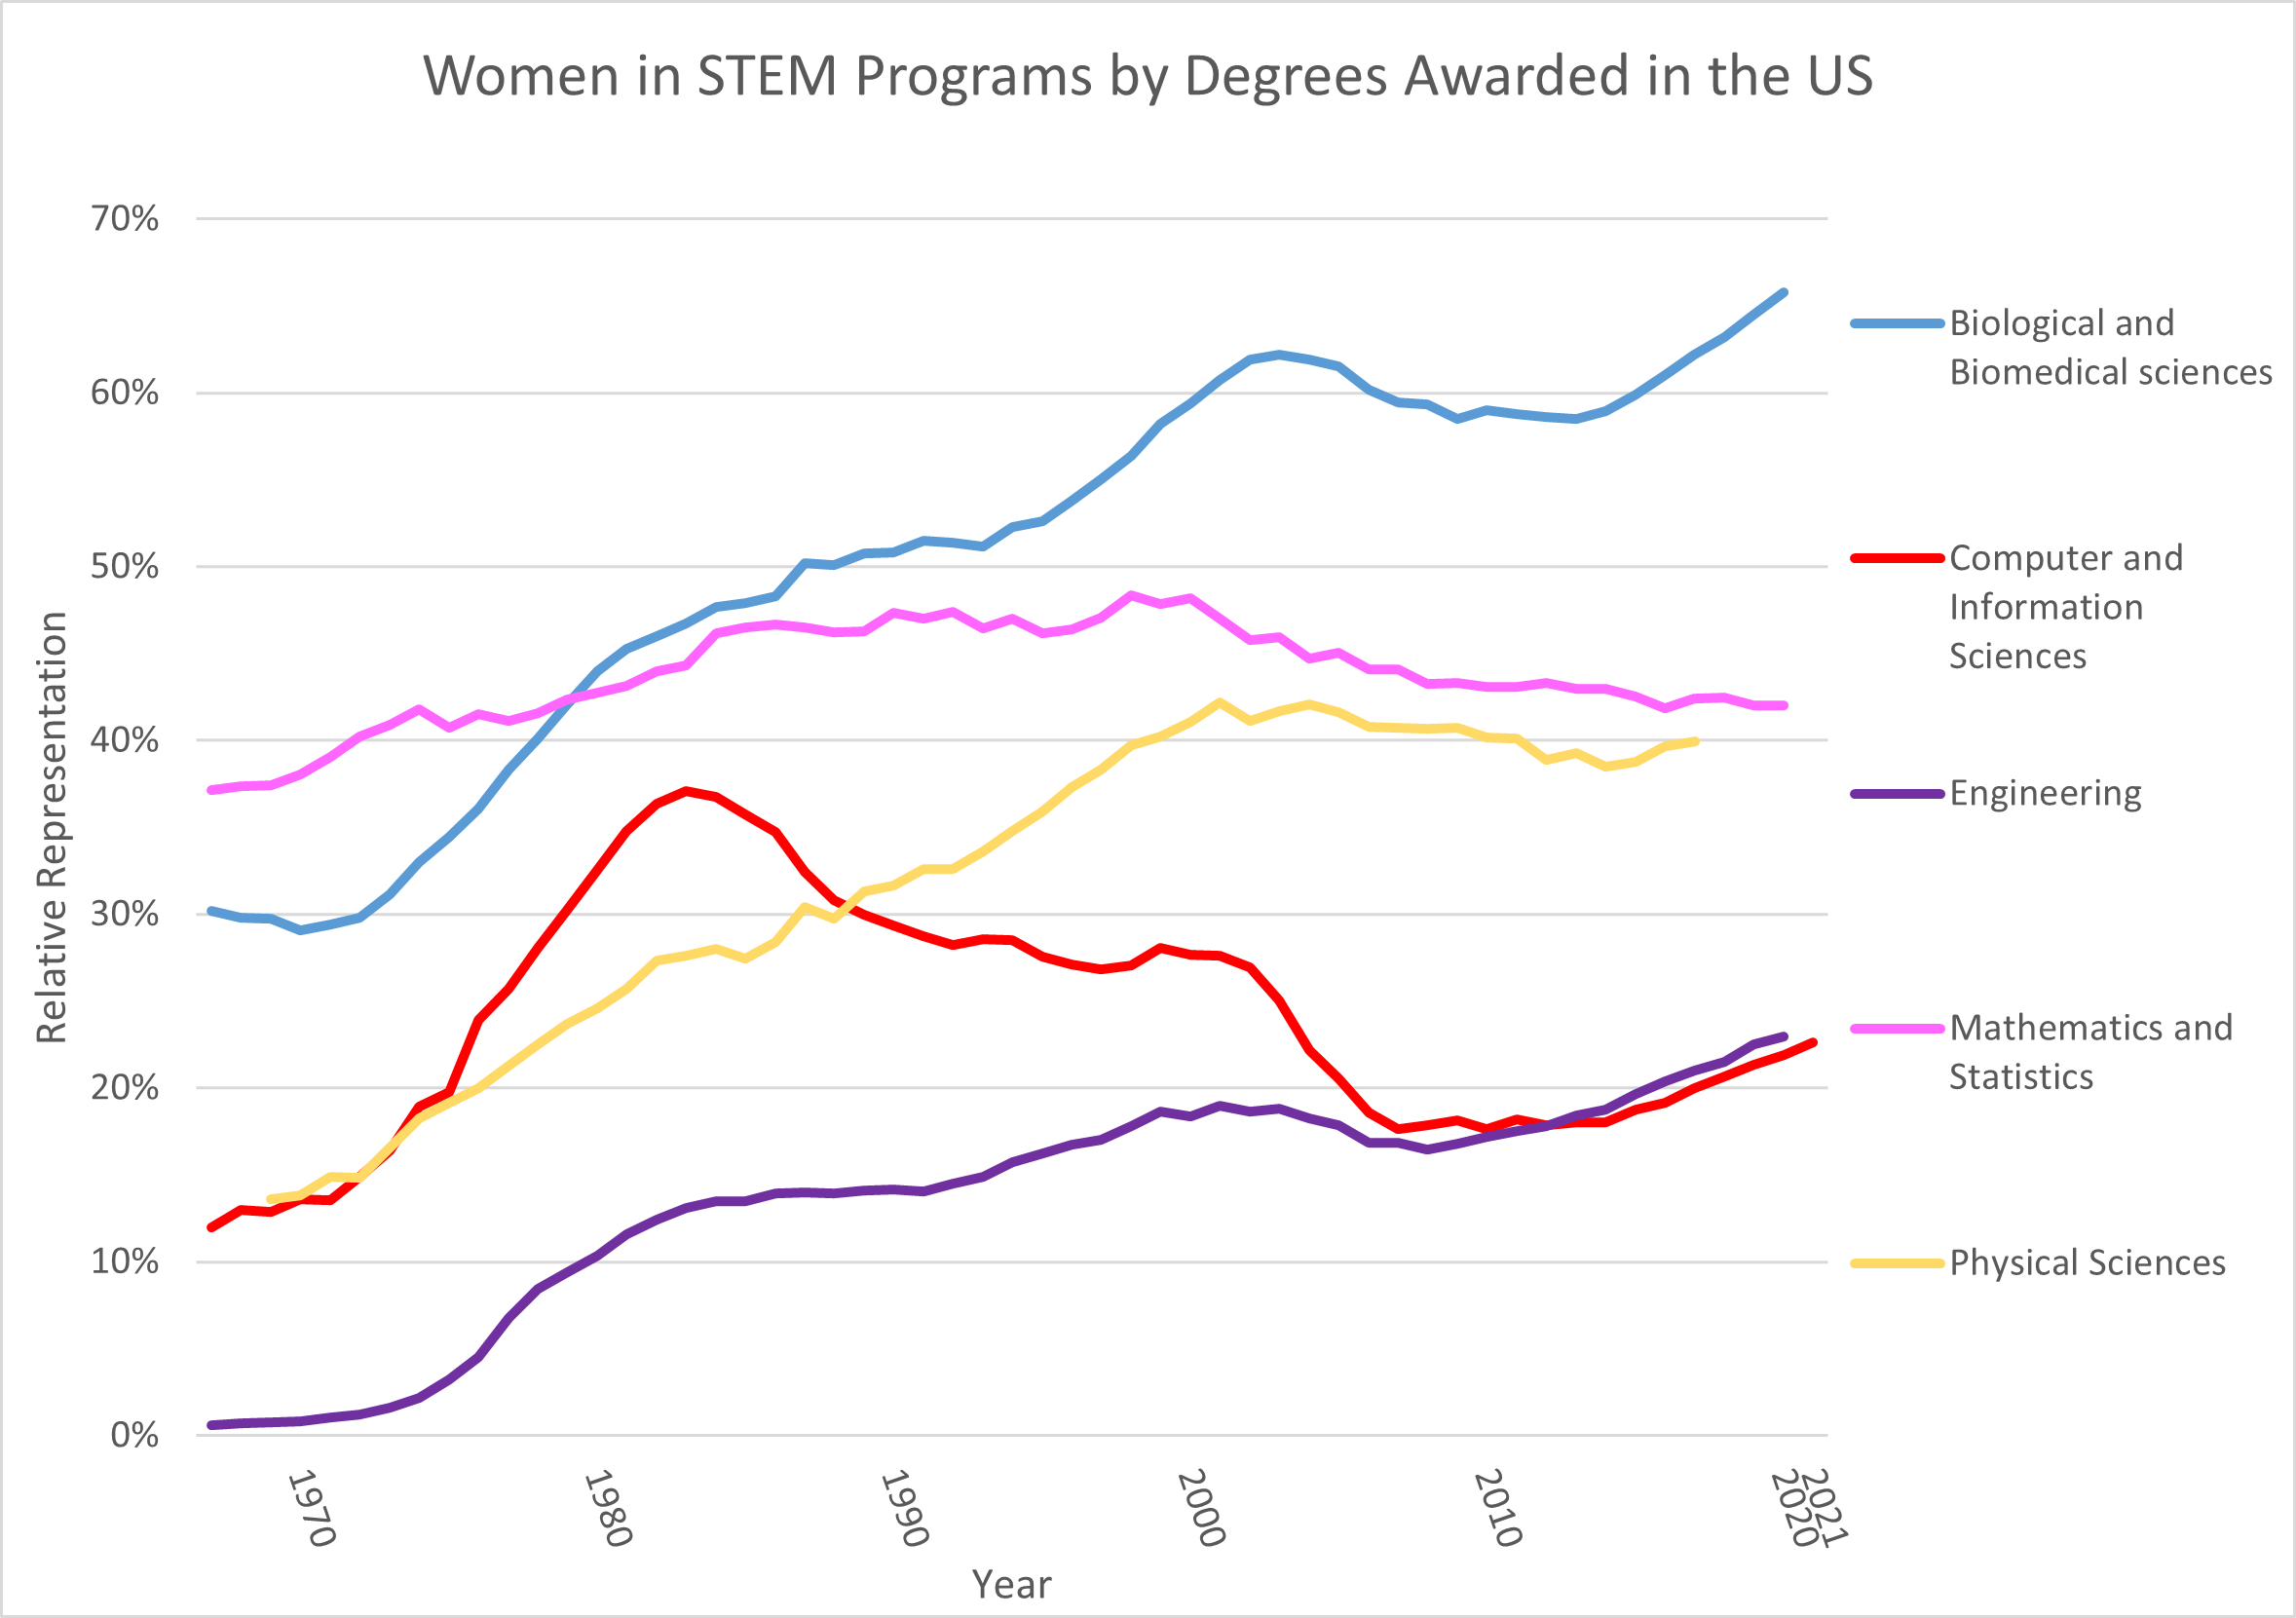
When universities first started to offer undergraduate degrees in CS, in the late 1960s and early 1970s, the representation of women in these programs rose quickly -- often faster than they were rising in other STEM disciplines. Representation peaked in the United States and Canada in the early 1980s, and then started to fall, even as the proportion of women in other technical disciplines continued to rise. The fact that computer-science programs used to have student populations that were 35%-40% women surprises a lot of people. We generally think of the representation of women in CS as being perpetually low.
Everyone asks why the representation of women fell so far from its peak. Many people attribute this decline to the advent of the personal computer. When personal computers were first introduced, they were marketed almost exclusively to men and boys and they were marketed heavily to electronics hobbyists, who were mostly men. Families tended to buy them for their sons, or they bought a computer for their kids but the earliest computer games and software had little appeal to girls so girls spent less time using computers than boys did.
The biggest problem was that personal computers were relatively rare. Schools, libraries, and homes didn’t have enough computers for everyone, which meant that there was competition for access to the machines. The boys were keener, and they dominated in their access to computers.
By the time these students reached university, the men typically had more experience using and experimenting with computers than the women had, which made the women feel like they were behind before their computer studies had even started! Even women with the strongest math and technical skills gravitated to other technical disciplines, where the playing field was more even.
This experience gap appears to be narrowing. For one thing, personal computers and digital devices are becoming ubiquitous. Almost all students arrive at university with some working experience and comfort in using technology. Moreover, students of both genders participate in coding camps in greater numbers. As a result, the gender gap between boys’ and girls’ usage and comfort with computers is narrowing, and we are starting to see increases in the enrollment of women in computer science programs.
References: U.S. National Center for Education Statistics
Undergraduate Degrees (in CS, worldwide)
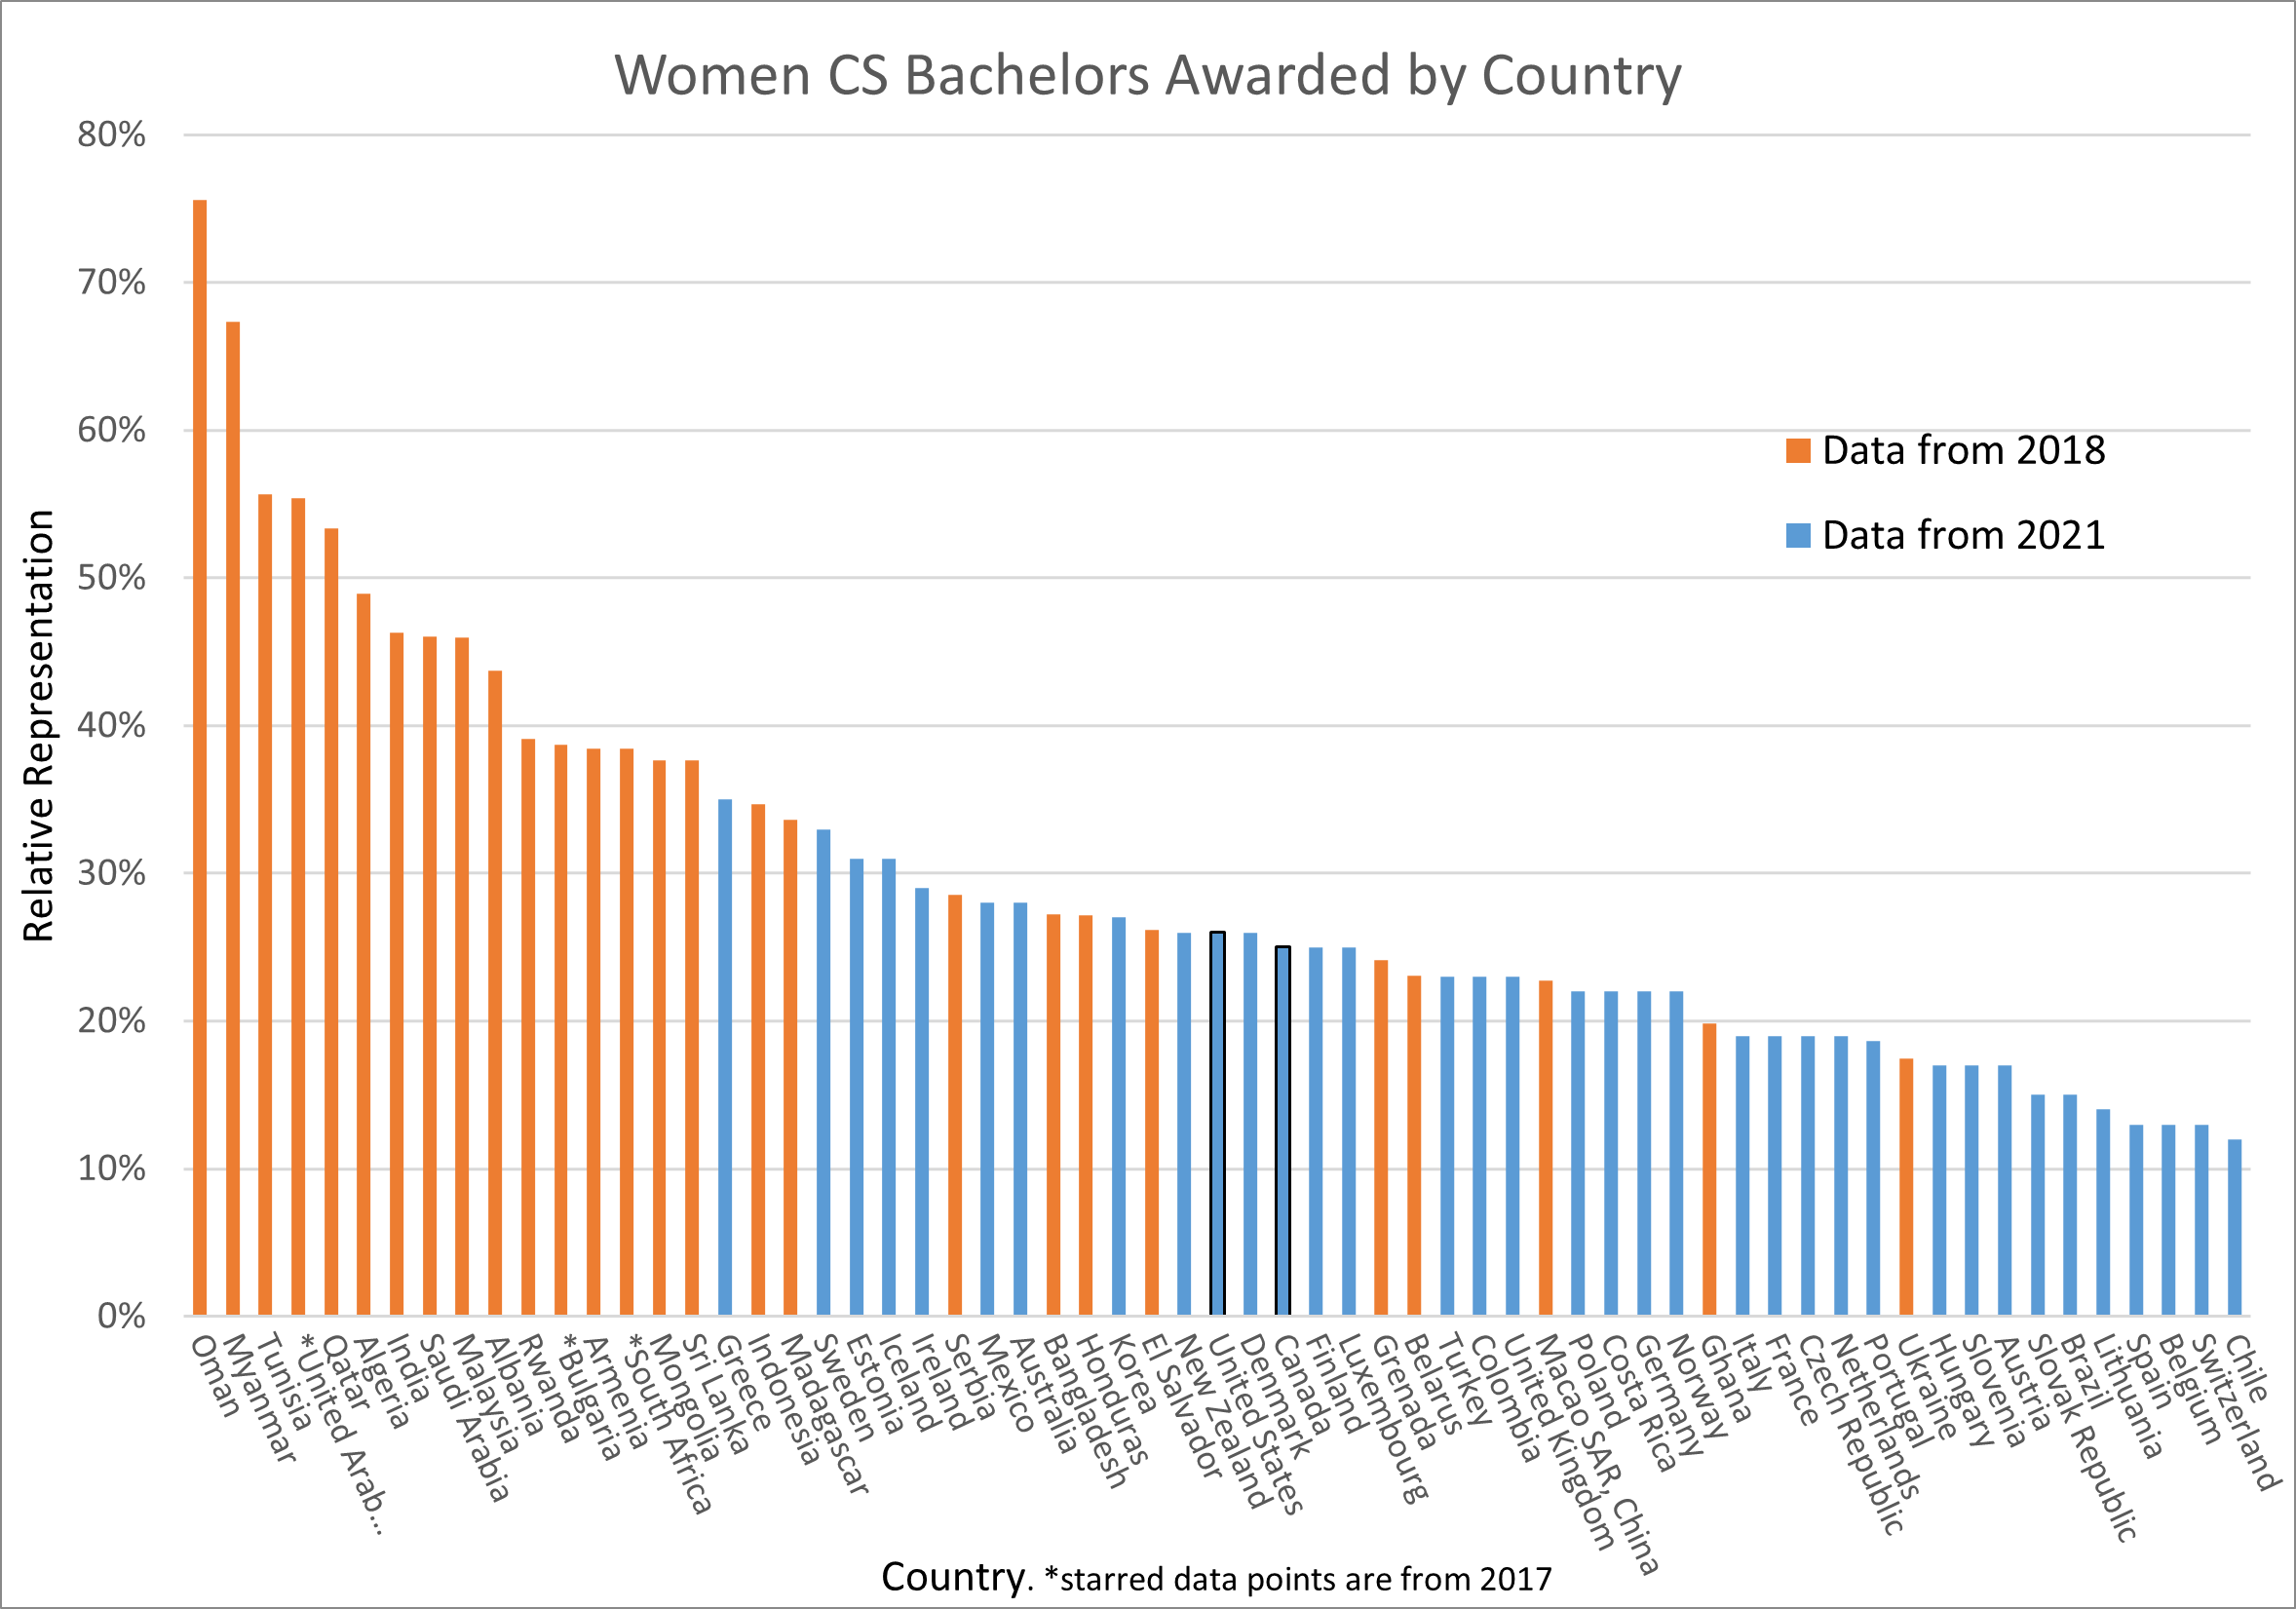
If there really were innate differences between men and women with respect to abilities or interests in computing, then we would expect to see the same levels of underrepresentation of women in computing worldwide. But as the statistics1,2 below show, the representation of women graduating from university-level computer science degrees vary wildly by country.
For comparison, the representation in North America in 2024 was 23.7%.3
The fact that there are these differences in different countries suggests that there are significant cultural differences and biases at play – biases both with respect to women and what they are capable of doing and biases about computing.
References:
1 OECD dataset showing Distribution of graduates by gender in fields of education (including the field Information and Communication Technologies), 2021.
2 UNESCO dataset showing Female share of graduates in Information and Communication Technologies, 2017-2018.
3 Computing Research Association, “The CRA Taulbee Survey”, 2024.
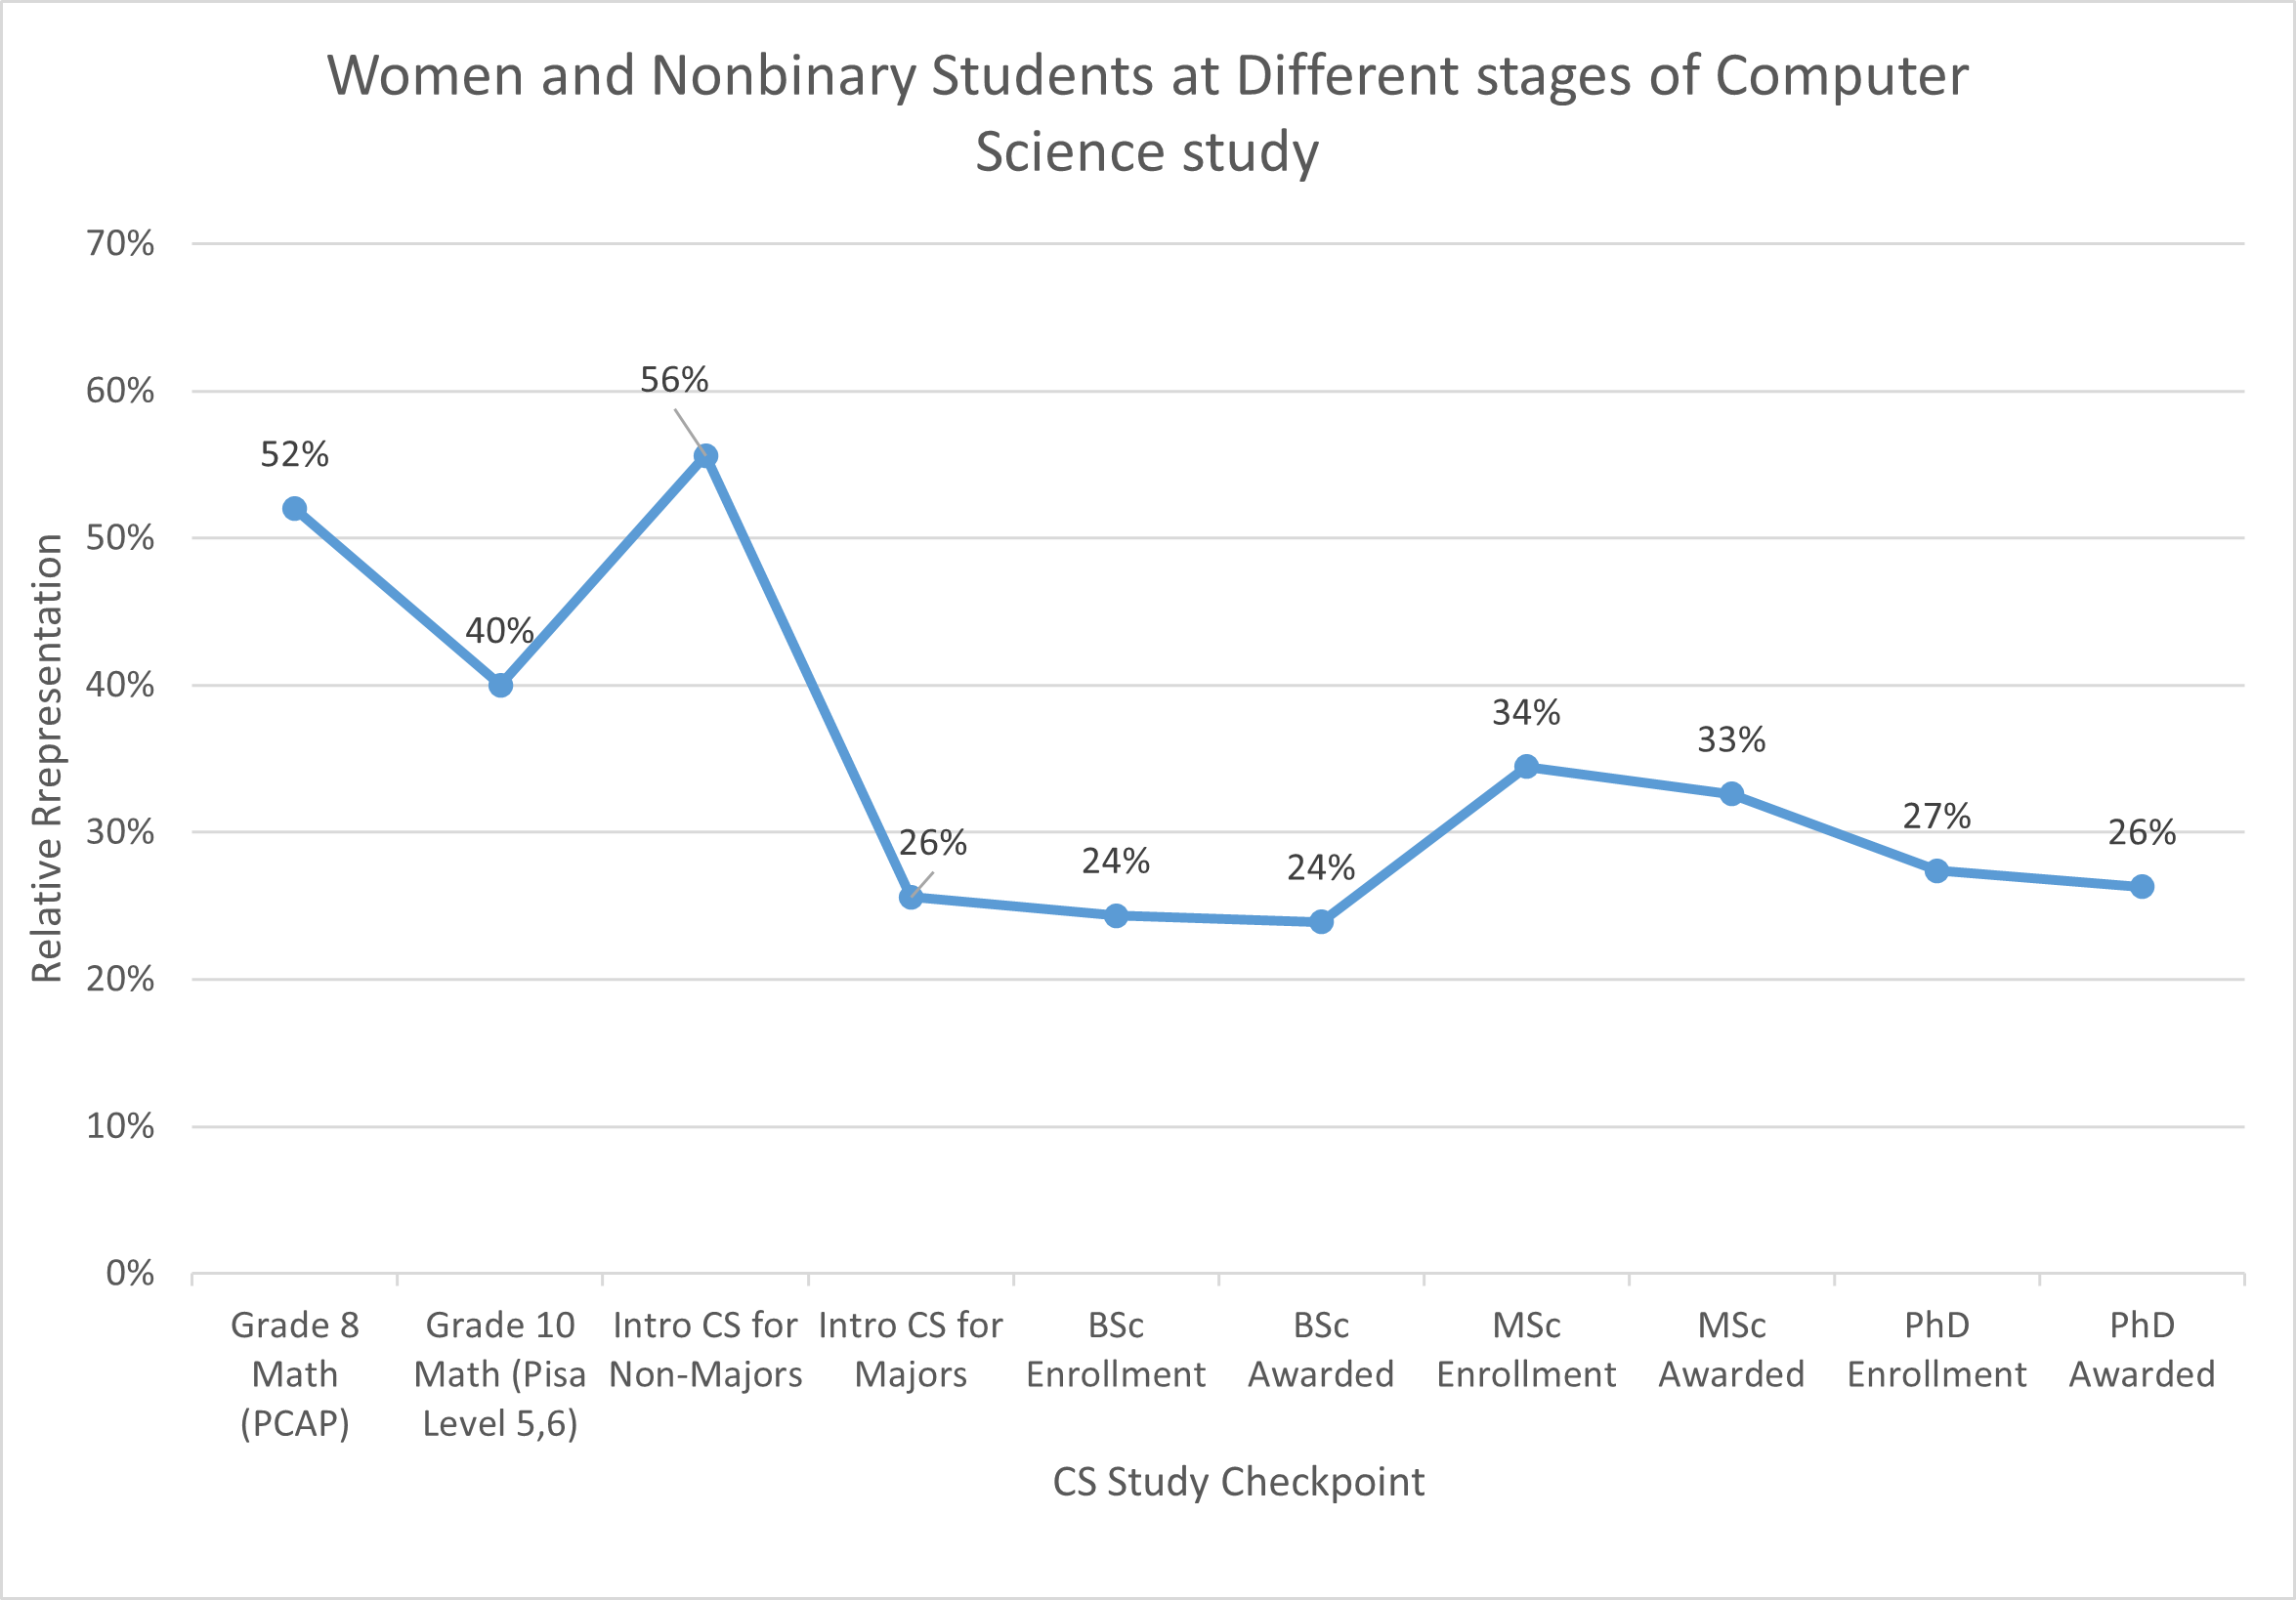
Leaky Pipeline
As the chart below shows, we lose women+ from CS at all stages of their studies.
A Longitudinal study of 2.6 million 1st graders starting in 2018 found deviations in Math testing scores between the genders start to appear as early as 1st grade, second semester, and continue to widen after that. "In infancy and early childhood, boys and girls exhibit similar core knowledge of number and space. Gender disparities in maths are, therefore, thought to primarily reflect an internalization of the sociocultural stereotype that ‘girls are bad at maths’."5
As early as Grade 8, despite performing as well as boys in math1, girls are more likely than boys to self-select out of advanced math and science courses and programs in secondary school.2,3
Women are also less likely than men to enroll in CS programs in university.3 The last several data points show the representation of women at different stages of CS studies in the same calendar year.3 As such, one cannot claim that the depicted lower representations of women at progressive stages in CS studies constitutes actual attrition of women at these stages. However, the fact that the representation is lower at every stage is worrying. Note that the percentage of women in graduate programs is higher than the percentage of women who graduate with a Bachelors’ degree in computing – the primary reason for this difference is that a large number of women in our graduate CS programs are international students.
Many of the WiCS initiatives aim to identify and address possible causes of attrition (leaks) of women enrolled in university-level CS programs.
Women in the Tech Workplace
For the last five years or so, tech companies have released diversity reports that have shown a light on the representation of women and other minorities in the tech work force. Here is data collected by DiversityReports.org from 2020 and 2021 diversity reports showing the percentage of women who hold technical roles at a number of the top tech companies. Overall, about 25% of professional computing roles in the 2020 U.S. workforce are held by women.2

Representation of Women in the U.S. workforce (2020)- download a larger version of this figure .png
Every tech company and tech workplace culture is different. Don’t judge the entire discipline of computing by the culture of a single company or a single team. Ask your friends and colleagues about what it is like to work at different companies. During interviews, ask about the company’s philosophy and practices with respect to creating inclusive mindsets and teams.
If you experience problems with your boss or your team, try to transfer to another team or move to another company: leave the hostile environment, not the discipline.
References:
1 Company diversity reports, as reported by DiversityReports.org
2U.S. Department of Labor Bureau of Labor Statistics, “Labor Force Statistics from the Current Population Survey,” Table 11. Employed and Experienced Unemployed Persons by Detailed Occupation, Sex, Race, and Hispanic or Latino Ethnicity, 2020.