Employment access in Kitchener-Waterloo

Introduction

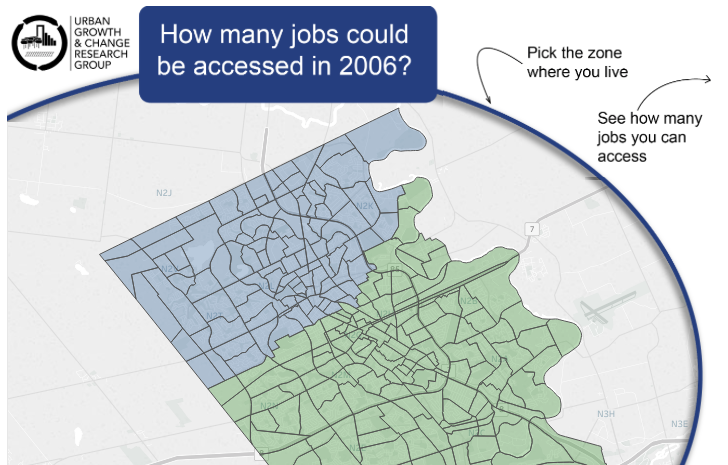
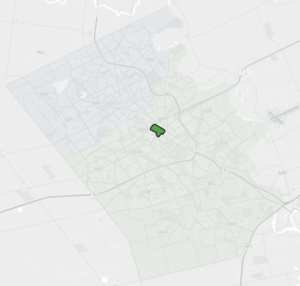
Accessibility reflects the ability of individuals to reach their destinations, given interactions between transportation systems, land use, and individual resources. Neudorf chooses to focus on accessibility to employment, using data from the 2006 Transportation Tomorrow Survey a survey of travel habits and household factors conducted in the Greater Golden Horseshoe. By using Traffic Analysis Zone (TAZ), a small unit of geographical area that normally has less than 3,000 residents, to measure survey results, the number of jobs accessible from each zone by each mode of travel and their associated costs can be calculated.

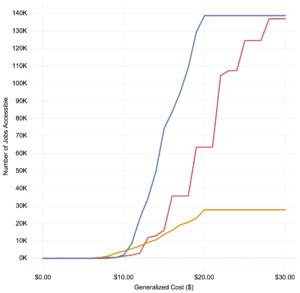
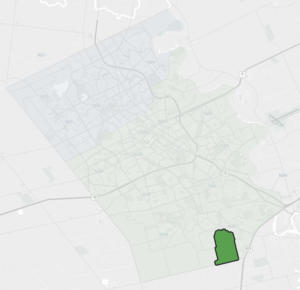
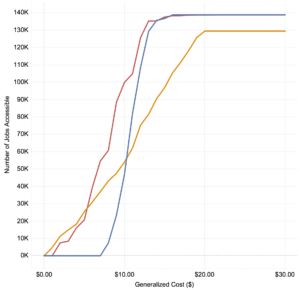
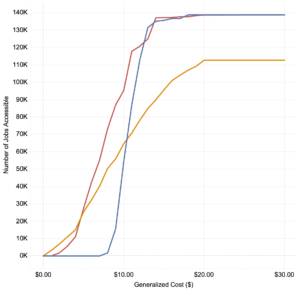
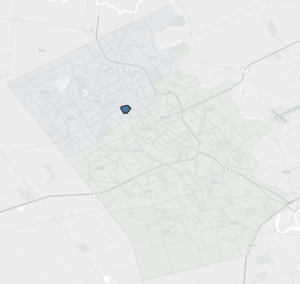
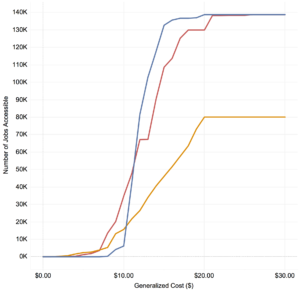
We have developed an interactive map where you can explore the results from Neudorf’s study. By clicking a TAZ on the interactive map, a chart of the costs of travel compared to number of reachable jobs is generated for each travel mode.

How many jobs could be accessed in 2006?

Background

The analysis carried out by Neudorf is known as accessibility profile analysis (APA), which calculates how many jobs could be reached for a given cost ($) using the least cost travel mode. “Generalized costs” include dollar estimates of the time spent traveling, and fixed costs of travel (ie. fares, gasoline). “Reachable destinations” in this case are the number of accessible jobs for a given transportation cost.

APA can be used to show areas underserved by transit, to identify areas with higher transportation “barriers to entry” to the local job market, and to find neighbourhoods that have poor employment access and/or infrastructure deficiencies. Furthermore, it can be used to evaluate a new transit system such as bus, light rail transit, or subways, and its ability to deliver high access to jobs, parks or recreation at a low generalized cost. It could also be used to determine impacts to a transport system by changing a piece of infrastructure or introducing a new travel option. For example, it could be used to determine the result of changes to a transportation system by shifting from A) streetcar to B) subways; or, examining the differences between different modes such as A) bus, B) express bus, or C) light rail transit.

To read more background about accessibility profile analysis and our other research, visit the Waterloo urban growth and change fall 2016 research symposium webpage.

Examples

Find out more

To find more about the applications of accessibility profile analysis and how it can be applied in the Kitchener-Waterloo context, you can read the thesis on UWSpace.