Compass Technical Report Series, Volume 6, Issue 3, October 2019
Student data linkage over multiple years
Table of contents
Acknowledgements
Introduction
Data linkage process
Creating two-year linked samples
Creating the multi-year sample
Example 1
Example 2
Example 3
Example 4
The COMPASS year 1 to year 4 linked longitudinal sample
Two-year linked samples
Table 1
The four-year linked sample
Table 2
Table 3
Discussion
References
Acknowledgements
Authors
Kate Battista (School of Public Health and Health Systems, University of Waterloo, Waterloo, ON)
Wei Qian (School of Public Health and Health Systems, University of Waterloo, Waterloo, ON)
Chad Bredin (School of Public Health and Health Systems, University of Waterloo, Waterloo, ON)
Scott T. Leatherdale (School of Public Health and Health Systems, University of Waterloo, Waterloo, ON)
Report funded by
The COMPASS study has been supported by a bridge grant from the CIHR Institute of Nutrition, Metabolism and Diabetes (INMD) through the “Obesity – Interventions to Prevent or Treat” priority funding awards (OOP-110788; awarded to SL), an operating grant from the CIHR Institute of Population and Public Health (IPPH) (MOP-114875; awarded to SL), a CIHR project grant (PJT-148562; awarded to SL), a CIHR bridge grant (PJT-149092; awarded to KP/SL), a CIHR project grant (PJT-159693; awarded to KP), and by a research funding arrangement with Health Canada (#1617-HQ-000012; contract awarded to SL).
Suggested citation
Battista K, Qian W, Bredin C, Leatherdale ST. Student Data Linkage over Multiple Years. Technical Report Series. (2019); 6(3): Waterloo, Ontario: University of Waterloo.
Contact
COMPASS research team
University of Waterloo
200 University Ave West
Waterloo, ON
Canada
N2L 3G1
uwaterloo.ca/compass-system.
Introduction
COMPASS is an ongoing longitudinal study (started in 2012-13) designed to follow a prospective cohort of grade 9 to 12 students attending a convenience sample of Canadian secondary schools over several years to understand how changes in school environment characteristics (policies, programs, built environment) and provincial, territorial, and national policies are associated with changes in youth health behaviours [1]. COMPASS originated to provide school stakeholders with the evidence to guide and evaluate school-based interventions related to obesity, healthy eating, tobacco use, alcohol and marijuana use, physical activity, sedentary behaviour, school connectedness, bullying, mental health, and academic achievement. COMPASS has been designed to facilitate multiple large-scale school-based data collections and uses in-class whole-school sampling data collection methods consistent with previous research [2-5]. COMPASS also facilitates knowledge transfer and exchange by annually providing each participating school with a school-specific feedback report that highlights the school-specific prevalence for each outcome, comparisons to provincial/territorial and national norms or guidelines, and provides evidence-based suggestions for school-based interventions (programs and/or policies) designed to address the outcomes covered in the feedback report. (refer to: www.compass.uwaterloo.ca).
COMPASS uses an anonymous, self-administered questionnaire (Cq) to obtain student-level data. One challenge associated with the COMPASS data is to track students over time while maintaining anonymity. COMPASS tracks students using a self-generated code based on questions included in the Cq. This self-generated code serves as an identifier that can be used to track students across multiple years while maintaining anonymity [6,7]. The process to link students over two years using this code is described in detail in Technical Report Volume 3, Issue 4 [8]. The process to link students across more than two years builds on the two-year linkage process. The purpose of this report is to outline the data linkage process used to link students across multiple years of COMPASS.
Data linkage process
Students are linked anonymously over time using a self-generated identification code (SGID). A series of two-year links are first generated, and then these two-year linked samples are combined to create a final multi-year linked sample. The following section describes the process of creating two-year and multi-year links.
Creating Two-Year Linked Samples
Students are linked across any two years using a self-generated code derived from questions in the COMPASS Cq. The Cq includes five questions designed for linkage purposes only. More information on the creation and validation of the linkage questions is provided in Technical Report Volume 1 Issue 2 [6]. Students are asked to provide the following information:
- The first letter of your middle name (if you have more than one middle name use your first middle name; if you don't have a middle name, use "z").
- The name of the month you were born in.
- The last letter of your full last name.
- The second letter of your full first name.
- The first initial of your mother’s first name (think about the mother you see the most).
Responses to these questions are combined with the student’s sex (“Are you male or female?”) to create a six-digit alpha-numeric code.
Students are linked within each school. Any student who has answered “No” to the Cq question “Did you attend this school last year?” in the most recent year being linked is excluded from the linkage process. Within each school, the self-generated codes are compared across the two years (Ya and Yb) record-by-record. Students are first matched on all six digits: if the code for record A in Ya matches the code for record B in Yb, A and B are considered to be a match. The remaining students are then matched on any five out of six digits.
Additional restrictions are then applied to all matches to reduce false-linkage error. The restrictions are based on the number of years between Ya and Yb. Using responses to other questions from the Cq, the match is dissolved if:
- the difference in grade between Ya and Yb is less than (Yb-Ya)-1 or greater than (Yb-Ya)
- the difference in age between Ya and Yb is less than (Yb-Ya)-1 or greater than (Yb-Ya)+1
After the restrictions have been applied, the sample is checked for multiple matches. In the case that a record has multiple matches, a series of conditions are applied to determine which match to keep. The following conditions are applied in order until exactly one match satisfies all criteria:
- The difference in grade between Ya and Yb is equal to Yb-Ya, the difference in age between Ya and Yb is equal to Yb-Ya, self-reported ethnicity is the same between Ya and Yb.
- The difference in age between Ya and Yb is equal to Yb-Ya, self-reported ethnicity is the same between Ya and Yb.
- Self-reported ethnicity is the same between Ya and Yb.
The match that satisfies the most stringent criteria is kept and other matches are dissolved. Any cases of multiple matches remaining after this process are dissolved. The remaining set of unique matches after the restrictions and conditions have been applied constitute the final two-year linked sample. A full description of the creation and evaluation of the year 1 to year 2 linked sample is provided in Technical Report Volume 3, Issue 4 [8].
Creating the Multi-Year Sample
To create the multi-year linked sample, all possible combinations of two-year links are first created. For example, for a four-year linked sample, the following six two-year links are created: Y1-Y2, Y1-Y3, Y1-Y4, Y2-Y3, Y2-Y4, Y3-Y4. The 6 samples are then combined by creating clusters of associated records. The cluster joins the two-year links to create a multi-year link for a given record.
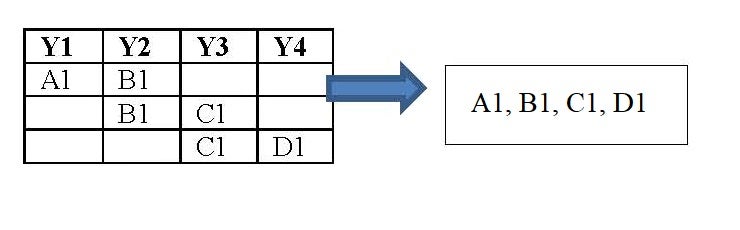
If a cluster contains two or more records for a given year, all records with the cluster are removed for the given year. The following examples illustrate cases of the process of creating clusters for a four-year linked sample:
In Y1-Y2, A1 in Y1 is linked with B1 in Y2, in Y2-Y3, B1 is linked with C1, and in Y3-Y4, C1 is linked with D1. A cluster is created including A1, B1, C1, and D1. Then this becomes a four-year link.
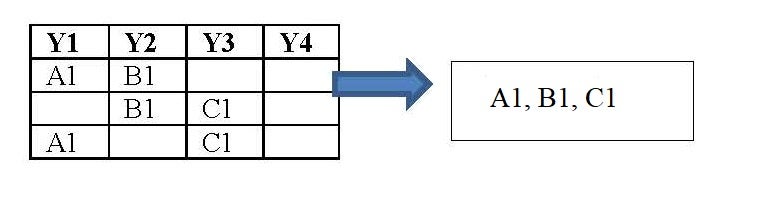
In Y1-Y2, A1 in Y1 is linked with B1 in Y2. In Y1-Y3, A1 in Y1 is linked with C1 in Y3. In Y2-Y3, B1 in Y1 is linked with C1 in Y3. In this case, A1 links both directly to C1 and indirectly through B1. A cluster is created including A1, B1 and C1. This becomes a three-year link.
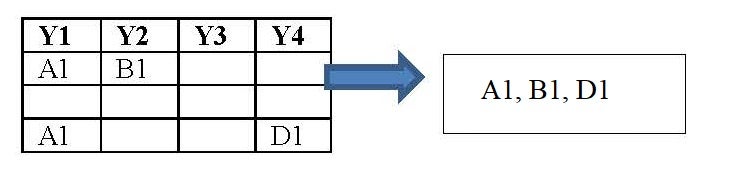
Example 3 – Link with missing year
In Y1-Y2, A1 in Y1 is linked with B1 in Y2. In Y1-Y4, A1 in Y1 is linked with D1 in Y4. A cluster is created using A1, B1 and D1. This becomes a three-year link of Y1-Y2-Y4, with Y3 data missing.
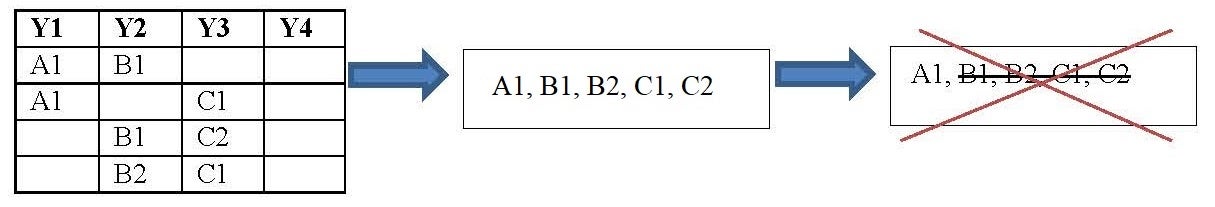
In Y1-Y2, A1 in Y1 is linked with B1 in Y2, in Y1-Y3, A1 is linked with C1, and in Y2-Y3, B1 is linked with C2 and B2 is linked with C1. Then a cluster is created including A1, B1, B2, C1, and C2. Since B1 and B2 are from the same year, we remove both of them. The same goes with C1 and C2. Finally, this cluster includes only A1, which we don’t include in the linkage file.
Once any records with multiple matches within a cluster are removed, the remaining matches constitute the final multi-year linked sample. The sample will contain any students for which at least two years of data have been linked. For example, a four-year linked sample would have 11 possible match patterns: 0011, 0101, 0110, 0111, 1001, 1010, 1011, 1100, 1101, 1110, 1111. In this example, a 1 indicates presence and 0 indicates absence. The first digit represents for the status in Y1, and the second digit for Y2, and so on. The pattern 1111 indicates that a student was successfully linked across all four years of data collection. Students with this match pattern would comprise the “complete case” sample.
For matches with one or more years missing, the missing years could be for a variety of reasons: student non-response in a given year, missing linkage, student ineligibility (did not start high school yet or has graduated), etc. When dealing with missing years, it is important to understand the mechanism behind the absence.
The COMPASS Year 1 to Year 4 Linked Longitudinal Sample
The following section describes the linkage results for the COMPASS Y1 to Y4 linked longitudinal sample.
Two-Year Linked Samples
Cross-sectional samples from Y1 to Y4 were used to create six two-year linked samples: Y1-Y2, Y1-Y3, Y1-Y4, Y2-Y3, Y2-Y4, and Y3-Y4. Matches were created by linking the self-generated codes from each year following the process described above. The matches were subject to the following restrictions:
For Y1-Y2, Y2-Y3, and Y3-Y4:
- 0 <= difference in age <= 2
- 0 <= difference in grade <=1
For Y1-Y3, Y2-Y4:
- 1 <= difference in age <= 3
- 1 <= difference in grade <=2
For Y1-Y4:
- 2 <= difference in age <= 4
- 2 <= difference in grade <=3
Table 1 shows the distribution of linked students by match type for each two-year link after all restrictions have been applied and remaining multiple matches have been removed.
Table 1: Linked units for Year 1 -2, Year 1 -3, Year 1 –4, Year 2 -3, Year 2-4, and Year 3-4
|
Year 1 - 2 (43 schools) |
Year 2 - 3 (86 schools) |
Year 1 - 3 (41 schools) |
Year 1 - 4 (38 schools) |
Year 2 - 4 (79 schools) |
Year 3 - 4 (80 schools) |
||||||||||
|
Match Type |
n |
% |
n |
% |
n |
% |
n |
% |
n |
% |
n |
% |
|||
|
A |
33 |
0.3 |
71 |
0.4 |
22 |
0.4 |
12 |
0.4 |
49 |
0.4 |
77 |
0.4 |
|||
|
B |
411 |
3.7 |
677 |
3.4 |
257 |
4.1 |
108 |
4.0 |
421 |
3.8 |
642 |
3.5 |
|||
|
C |
2291 |
20.7 |
4064 |
20.5 |
1312 |
21.0 |
530 |
19.6 |
2181 |
19.6 |
3502 |
19.3 |
|||
|
D |
513 |
4.6 |
870 |
4.4 |
312 |
5.0 |
172 |
6.4 |
553 |
5.0 |
754 |
4.2 |
|||
|
E |
498 |
4.5 |
810 |
4.1 |
253 |
4.1 |
109 |
4.0 |
457 |
4.1 |
694 |
3.8 |
|||
|
F |
110 |
1.0 |
186 |
0.9 |
59 |
0.9 |
36 |
1.3 |
144 |
1.3 |
172 |
1.0 |
|||
|
ALL MATCH |
7193 |
65.1 |
13176 |
66.4 |
4023 |
64.5 |
1741 |
64.3 |
7339 |
65.9 |
12271 |
67.8 |
|||
|
Total |
11049 |
100.0 |
19854 |
100.0 |
6238 |
100.0 |
2708 |
100.0 |
11144 |
100.0 |
18112 |
100.0 |
|||
|
A: only the name of the month was not matched. B: only the first letter of your middle name was not matched. C: only the last letter of your full last name was not matched. D: only the first initial of your mother's first name was not matched. E: only the second letter of your full first name was not matched. F: only the gender was not matched. |
|||||||||||||||
The Four-Year Linked Sample
The six two-year linked samples were then combined by creating clusters of associated records. Table 2 shows the number of students linked by linkage pattern.
Table 2: Four-year linked sample size by linkage pattern
|
Pattern |
Linked Years |
Frequency |
Percent |
Cumulative |
Cumulative |
|
0011 |
Y3-Y4 |
8857 |
23.19 |
8857 |
23.19 |
|
0101 |
Y2-Y4 |
1786 |
4.68 |
10643 |
27.87 |
|
0110 |
Y2-Y3 |
7729 |
20.24 |
18372 |
48.11 |
|
0111 |
Y2-Y3-Y4 |
7223 |
18.91 |
25595 |
67.02 |
|
1001 |
Y1-Y4 |
185 |
0.48 |
25780 |
67.51 |
|
1010 |
Y1-Y3 |
950 |
2.49 |
26730 |
69.99 |
|
1011 |
Y1-Y3-Y4 |
367 |
0.96 |
27097 |
70.95 |
|
1100 |
Y1-Y2 |
5611 |
14.69 |
32708 |
85.65 |
|
1101 |
Y1-Y2-Y4 |
488 |
1.28 |
33196 |
86.93 |
|
1110 |
Y1-Y2-Y3 |
3270 |
8.56 |
36466 |
95.49 |
|
1111 |
Y1-Y2-Y3-Y4 |
1723 |
4.51 |
38189 |
100.00 |
In total, the complete four-year sample includes 1,723 students from 38 schools. Table 3 presents characteristics for the four-year sample. As expected, most students were in grade 9 and age 14 at baseline. More females than males were linked.
Table 3: Student characteristics for four-year sample (Pattern = “1111”)
|
Frequency |
Percent |
Cumulative |
Cumulative |
|
|
Age_Y1 |
||||
|
13 |
52 |
3.02 |
52 |
3.02 |
|
14 |
1277 |
74.11 |
1329 |
77.13 |
|
15 |
376 |
21.82 |
1705 |
98.96 |
|
16 |
15 |
0.87 |
1720 |
99.83 |
|
17 |
1 |
0.06 |
1721 |
99.88 |
|
Not Stated |
2 |
0.12 |
1723 |
100.00 |
|
Grade_Y1 |
||||
|
9 |
1629 |
94.54 |
1629 |
94.54 |
|
10 |
89 |
5.17 |
1718 |
99.71 |
|
11 |
2 |
0.12 |
1720 |
99.83 |
|
Not Stated |
3 |
0.17 |
1723 |
100.00 |
|
Sex_Y1 |
||||
|
Female |
937 |
54.38 |
937 |
54.38 |
|
Male |
781 |
45.33 |
1718 |
99.71 |
|
Not Stated |
5 |
0.29 |
1723 |
100.00 |
Discussion
As the largest longitudinal cohort study of youth health in Canada, COMPASS is uniquely positioned to evaluate the how changes in student-, school- and environment-level factors influence changes in student health over time. The COMPASS linked longitudinal sample provides valuable information for assessing changes in individuals over time. Compared to cross-sectional studies, longitudinal cohort studies have the ability to establish temporal sequence to assess causality, reduce confounding, and increase power to detect an effect. Unlike many longitudinal cohort studies, COMPASS uses an anonymous method of linking students over time. This anonymity is vitally important in order to obtain honest responses, given that many of the health behaviours studied are of a sensitive nature or illegal for youth to engage in.
The linkage process described above provides a straightforward means of collecting anonymous linked longitudinal data over time. An imperfect linkage rate must be weighed against the benefit of anonymity in data collection. The self-generated code used is simple to generate and based on measures that are not likely to change within individuals over time. Additional restrictions in the linkage process ensure accuracy of the linked sample, perhaps at the expense of a potentially higher matching rate. Given that data accuracy and respondent anonymity are two primary concerns in any study of youth health, we feel that any corresponding potential limitation to absolute linkage rates is acceptable. By utilizing a large sample and the linkage process described above, we feel that COMPASS has a robust and effective means for tracking students over time.
References
- Leatherdale ST, Brown KS, Carson, V, et al: The COMPASS study: a longitudinal hierarchical research platform for evaluating natural experiments related to changes in school-level programs, policies and built environment resources. BMC Public Health. 2014,14,33 doi:10.1186/1471-2458-14-331
- Leatherdale ST, Burkhalter R: The substance use profile of Canadian youth: exploring the prevalence of alcohol, drug and tobacco use by gender and grade. Addict Behav 2012, 37:318-32
- Leatherdale ST, Manske S, Faulkner G, Arbour K, Bredin C: A multi-level examination of school programs, policies and resources associated with physical activity among elementary school youth in the PLAY-ON study. Int J Behav Nutr Phys Act 2010, 25;6. doi: 10.1186/1479 -5868-7-6.
- Leatherdale ST, McDonald PW, Cameron R, Brown KS: A multi-level analysis examining the relationship between social influences for smoking and smoking onset. Am J Health Behav 2005, 29:520-530.
- Leatherdale ST, Papadakis S: A multi-level examination of the association between older social models in the school environment and overweight and obesity among younger students. J Youth Adolesc 2011, 40:361 - 372.
- Bredin C, Leatherdale ST. Methods for linking COMPASS student-level data over time. COMPASS Technical Report Series. 2013;1(2). Waterloo, Ontario: University of Waterloo. Available at: www.compass.uwaterloo.ca.
- Kearney K, Hopkins RH, Mauss AL and Weisheit RA: Self-Generated Identification Codes for Anonymous Collection of Longitudinal Questionnaire Data. The Public Opinion Quarterly, Vol. 48, No. 1 (Spring, 1984), pp. 370-378.
- Qian W, Battista K, Bredin C, Brown KS, Leatherdale ST. Assessing longitudinal data linkage results in the COMPASS study: Technical Report Series. 2015; 3(4). Waterloo, Ontario: University of Waterloo.