- COMPASS Quebec: Teenagers and COVID-19
- COMPASS Quebec: Cannabis Use Among High School Students
- COMPASS Quebec: The COVID-19 pandemic and the evolution of psychoactive substance use among adolescents. An analysis of school cohorts
- COMPASS Quebec: The evolution of adolescent mental health during the COVID -19 pandemic . An analysis of COMPASS - Quebec school cohorts
- E-cigarette use among young people during the pandemic: An analysis of COMPASS-Québec school cohorts from 2018 to 2021
- Environmental concerns and adolescent involvement in the fight against climate change: An analysis of the COMPASS-Québec 2022 school cohort
- The mental health of high school students is deteriorating and inequalities are widening. Analysis of COMPASS-Québec school cohorts from 2018 to 2022
- Cessation of electronic cigarette use among adolescents. Attempts to quit and barriers encountered. An analysis of the COMPASS-Québec school cohorts (2022-2023).
- Effects of the ban on flavored vaping products on e-cigarette use among adolescents.
- Going to bed late, getting up early, and not getting enough sleep. Analysis of young people's sleep needs in the COMPASS-Québec 2025 survey.
Adolescents and COVID-19: Preliminary results of the 2020 COMPASS surveys in 29 high schools in 3 regions of Eastern Quebec
Link to the report Adolescents and COVID-19 : Preliminary results of the 2020 COMPASS surveys in 29 secondary schools in 3 regions of Eastern Quebec
Authors
Slim Haddad, MD, PhD
Full Professor, Department of Social and Preventive Medicine, Faculty of Medicine, Laval University; Researcher, Laval University Sustainable Health Research Centre (VITAM);
Medical Advisor to the Regional Public Health Department of the Capitale-Nationale.
Richard E. Bélanger, MD
Pediatrician/Adolescent Physician, Soleil Mother-Child Centre of the CHU de Québec-Université Laval;
Associate Professor, Department of Pediatrics, Faculty of Medicine, Université Laval;
Associate Researcher, Centre for Sustainable Health Research of Université Laval (VITAM).
Claude Bacque Dion, MA
Scientific Coordinator COMPASS-Québec.
Rabbi Joel GansaonréMSc
Doctoral Candidate, Department of Social and Preventive Medicine, Faculty of Medicine, Laval University;
Manager and Data Analyst COMPASS-Québec.
Scott T Leatherdale, PhD
Principal Investigator, COMPASS-Canada Project;
Associate Professor, School of Public Health and Health Systems, University of Waterloo, ON, Canada.
François DesbiensMD, MPH,
Clinical Professor, Department of Social and Preventive Medicine, Faculty of Medicine, Laval University.
August 2020
Funding
COMPASS-Québec benefits from research grants and support from the Ministry of Health and Social Services, Government of Quebec, the University of Waterloo (Health Canada – Canadian Institutes of Health Research) and the Regional Public Health Department of the Capitale-Nationale.
This report presents the results of the COMPASS-Quebec 2020 study conducted in 29 secondary schools in Eastern Quebec. COMPASS is a longitudinal, multicenter project on adolescent realities in Canada. It is one of the largest longitudinal population-based platforms on adolescent health in the world.
The Quebec component brings together researchers from Laval University, schools and the regional public health departments of Capitale-Nationale, Chaudière-Appalaches and Saguenay-Lac-Saint-Jean 1 .
The 2020 survey round was conducted in May-June 2020, following the implementation of lockdown measures and school closures. The study methodology was adapted to include a "COVID-19" component designed to better understand the pandemic's impact on adolescents and to assist schools and public health teams in implementing prevention and promotion interventions tailored to their needs.
The questions related to COVID-19 covered the following five areas:
- Knowledge of COVID-19 and barrier gestures;
- Attitudes towards preventive measures;
- Degree of adoption of recommended preventive measures;
- Degree of adaptation to the situation created by the lockdown and the closure of schools;
- Impact of COVID-19 on everyday life;
- Consequences of COVID-19 on well-being, psychoactive substance use and mental health.
Participation by schools and young respondents in the study is voluntary. All students in the school are invited to complete the annual questionnaires. More than 6,000 adolescents have completed the online survey. The revised COMPASS project procedures and questionnaire content have been approved by the relevant ethics committees.
The sample comprises 6,052 respondents (61% girls and 39% boys, mean age 15.8 years). The active refusal rate to participate in the survey is 1%. The average proportion of respondents per participating school is 43%. The data have been weighted to reflect the characteristics of the study population.
Before the start of the school year, the COMPASS Québec team will provide each participating school with a summary of student responses. This report offers an overview of the responses obtained from participating schools. The results reflect the reality of adolescents in the schools participating in the COMPASS survey. Therefore, they may not be representative of the reality in all schools.
Knowledge of COVID-19 and preventative measures
Proportion of young people who stated that they believed that:
- Washing your hands vigorously prevents the transmission of the virus: 73%
- COVID-19 is an infectious respiratory disease caused by a bacterium: 55%
- Symptoms appear between 2 and 14 days after exposure: 67%
- COVID-19 can be transmitted from person to person through droplet contact: 72%
- COVID-19 can be transmitted by touching something/someone contaminated, then touching your face: 89%
- Using an alcohol-based hand sanitizer (Purell©) prevents the transmission of the virus: 59%
- When a person coughs, wearing a mask can reduce droplet transmission by 67%.
- Individuals infected with COVID-19 still exhibit symptoms: 5%
- COVID-19 is only dangerous for the elderly: 12%
- COVID-19 poses little risk of complications for young people: 78%
To deal with Covid-19
Proportion of young people who reported:
- 63% have stayed in touch with their friends online
- Having eaten "fast food": 14%
- Having exercised: 51%
- Having communicated with mental health professionals: 3%
- having met their friends outside: 28%
- Having tried to help others: 19%
- having maintained a regular schedule: 30%
- having spent time with their family: 46%
- having studied or done schoolwork: 57%
- having spent time on their screens: 63%
- having smoked cigarettes: 1%
- vaping: 6%
- cannabis use: 2%
- Having consumed alcohol: 7%
Adoption of preventive measures
Proportion of young people who reported:
- Having cleaned/disinfected frequently touched objects: 73%
- having cleaned their hands more often than usual: 94%
- Having taken government measures to reduce the spread of COVID-19 seriously: 95%
- having cancelled or rescheduled outings: 83%
- having discussed preventive measures: 74%
- having discussed the steps to take in case of infection: 64%
- avoiding crowded places: 89%
Effects of lockdown
Proportion of young people who reported an increase:
- of their online communications with their friends: 63%
- of their screen time: 75%
- of their level of physical activity: 30%
- of their sleep time: 38%
- of their cigarette use: 1%
- of their e-cigarette use: 5%
- of their alcohol consumption: 9%
- of their cannabis consumption: 2%
Proportion of young people who reported:
- 69% were afraid of falling behind in their schoolwork.
- got along well with their family: 96%
- 44% felt nervous thinking about the current circumstances
- 73% reported feeling worried about their own health or that of their family.
- 29% felt worried about their family's financial situation
Proportion of young people who reported an increase:
- of their boredom level: 67%
- of their stress level: 25%
- of their loneliness: 50%
- of their stress level: 25%
- of their anxiety level: 24%
Differences according to gender
Proportion of girls: |
Proportion of boys: |
|---|---|
|
|
Differences according to the level of family material support
Proportion of young people from
|
Proportion of young people from a
|
|---|---|
|
|
Key points
Knowledge, attitudes, practices
- Teenagers have a good understanding of COVID-19 and protective measures.
- Most of them know that it is possible to have the disease while remaining asymptomatic.
- They are familiar with the main modes of transmission and effective protective measures such as hand washing, wearing masks, and using hand sanitizer.
- Teenagers do not downplay the consequences of the disease.
- The majority say they are concerned about their health and that of their family members, and anxious about not falling behind in their schoolwork. Half feel nervous when they think about the current situation.
- Teenagers are adopting the recommended prevention measures.
- The vast majority say they are taking the measures dictated by the authorities seriously. Respondents are avoiding crowded places, canceling or postponing outings; they are washing their hands more often and cleaning or disinfecting frequently touched objects. More than two-thirds are discussing preventive measures with their family, friends, or healthcare professionals.
Impacts, adaptation, resilience
- Lockdown is having a major impact on the lives of teenagers, but not all are reacting in the same way.
- The majority are increasing their screen time and online interactions with friends. Many are struggling to maintain a regular schedule. Some are exercising more, others less. One in two respondents felt more alone, and two-thirds reported increased boredom. Three-quarters of teenagers indicated that their anxiety did not increase. However, some groups appear to have been more affected. Anxiety is more prevalent among girls and young people living in less privileged families.
- Teenagers generally adapt well to life in lockdown.
- The majority of respondents reported getting along well with their families during lockdown and maintaining contact with their friends. Most continued to study regularly. One in five teenagers is actively helping their community.
- The consumption of psychoactive substances among adolescents is not increasing, as might have been feared, during periods of confinement.
- Neither alcohol consumption nor the consumption of tobacco, cannabis or electronic cigarettes increased tangibly during the lockdown period.
Teenagers have a good understanding of COVID-19 and protective measures; most of them appear responsible and respectful of the precautionary measures put in place. They were significantly affected by life in lockdown. Their responses suggest that most of them were able to adapt.
The preliminary results presented in this overview are consistently observed in the 29 participating schools across the three study areas. In the coming months, the COMPASS-Québec team will further examine the needs and responses of the young survey participants. They will focus particularly on identifying vulnerabilities that might not be apparent from a general overview.
References
1 COMPASS Health Canada: https://uwaterloo.ca/compass-system/compass-system-projects/compass-health-canada
Cannabis use among high school students: COMPASS-Québec 2017 survey in 11 high schools in the Capitale-Nationale region
This report presents the results of the analysis of data from the COMPASS-Québec 2017 study on cannabis use by high school students in 11 schools in the Capitale-Nationale region.
- Link to the report : Cannabis use among high school students: COMPASS-Québec 2017 survey in 11 high schools in the Capitale-Nationale region
The COVID-19 pandemic and the evolution of psychoactive substance use among adolescents: An analysis of the COMPASS-Québec school cohorts (2019-2021)
Link to the report: The COVID-19 pandemic and the evolution of psychoactive substance use among adolescents: An analysis of school cohorts
Authors: Ève Bolduc, Claude Bacque Dion, Richard Bélanger & Slim Haddad
Substance abuse among adolescents
Adolescence is a period of experimentation, and many habits adopted during this time influence adult life. The specific context associated with the COVID-19 pandemic has potentially altered young people's substance use patterns. It is known that substance use is influenced by social context, the desire to enhance certain experiences, difficulties encountered (1), mental health status, external influences (friends, family), and the availability of substances (2). Recent research has examined adolescent substance use in the weeks and months following the start of the pandemic. Contrary to some expectations, a decrease in substance use among young people has been reported in Canada (3, 4, and 5).
What knowledge are we lacking?
Has the decline in consumption in the months following the outbreak of the COVID-19 pandemic continued? Have we returned to pre-pandemic levels? The evolution of consumption more than a year after the start of the pandemic is not yet established. Has substance use evolved differently for girls and boys, given that boys tend to use more? (6) What about heavy consumption practices, and in particular, daily use of cigarettes or e-cigarettes? How has the proportion of young people trying new substances changed?
What are the objectives and methods?
This study is based on data from the COMPASS longitudinal study in Quebec. The COMPASS Quebec school cohort project provides a longitudinal profile of the health and well-being of adolescents attending public and private secondary schools in the Capitale-Nationale, Chaudière-Appalaches, and Saguenay-Lac-Saint-Jean regions. All students in participating schools are invited annually to complete a questionnaire focusing on their health and substance use practices (7). This study uses a repeated cross-sectional design. The analysis focuses on data from the 25 secondary schools that participated in the three survey rounds in 2019, 2020, and 2021. This design allows for a comparison of substance use before the pandemic (May 2019), a few months after the start of the pandemic, after schools were closed (April-May 2020), and finally, one year after the start of the pandemic (May 2021). The sample thus created comprises 10,190 respondents in 2019, 3,830 in 2020, and 7,750 in 2021. The substance use considered includes cigarettes, e-cigarettes, cannabis, and excessive alcohol consumption. Two patterns of use are explored: initiation to a substance (use at least once in a lifetime) or regular use (at least monthly in the case of cannabis), and excessive alcohol use (at least five drinks in a single episode) and daily use in the case of cigarettes and e-cigarettes. The proportions of users are adjusted for the main confounders (sex, grade level, type of school, and socioeconomic status of respondents' families) using multiple regression. All analyses are performed using STATA 17 software.
What evidence has been gathered?
Initiation
Initiation to psychoactive substances during the first interval (May 2019 and April-May 2020) decreased in both girls and boys, regardless of the substance (Table 1). It then appears to increase one year after the pandemic, but remains significantly below pre-pandemic prevalence levels in all cases. The difference is more pronounced among boys (Table 2), and the difference in trends is statistically significant for all substances. Trends differ between girls and boys for e-cigarettes and episodes of excessive alcohol consumption, while the difference in trends is more limited for cigarettes and cannabis.


Regular use
The proportion of young people who regularly (daily) use cigarettes or e-cigarettes fluctuates. It tended to decrease significantly in 2020, as with other substances (Tables 3 and 4). Over the entire period, regular cigarette use remained stable for both sexes, as did the proportion of boys reporting regular e-cigarette use. In contrast, the proportion of girls reporting regular e-cigarette use increased substantially over the same period, rising from 4.8% to 7.7% (+2.9%; 95% CI 1.1%–4.7%). Excessive alcohol consumption and regular cannabis use followed a similar pattern at initiation for both girls and boys (decreasing in 2020, then increasing in 2021).


What can we conclude?
This cohort study examines changes in psychoactive substance use at three key periods: one preceding the pandemic, and two contemporaneous with it. The design allows us to assess observed changes in young people's substance use patterns and provide initial answers to questions about the evolution of substance use since the beginning of the pandemic. However, the study has limitations. Many changes occurred during the 24-month observation period, and it is difficult to establish a precise correlation between young people's responses, the course of the pandemic, and the public health measures implemented, such as lockdowns, school closures or reopenings, or the withdrawal of students during outbreaks. The specific circumstances encountered during the spring 2020 round of data collection led the team to modify the data collection process and, consequently, to a decrease in youth participation. Although the samples were weighted and analyzed accordingly, selection bias cannot be ruled out. Consumption estimates are adjusted for the main known confounders, but some residual confounding remains possible. Finally, the results observed in this cohort of schools located in three regions of Eastern Quebec still need to be confirmed in other contexts.
Nearly all the indicators considered support the idea of a reduction in the initiation and regular use of psychoactive substances during the 2020 round, when Quebec was under lockdown and high schools were closed. This was therefore a unique period where opportunities to use substances were limited by reduced social interaction and access to them.
Youth substance use tends to fluctuate according to the constraints on access to substances and their interactions with peers. One of the challenges is to continue fostering these interactions without them encouraging substance use (8), or even to ensure that they can be used as leverage to support youth health protection initiatives. E-cigarette use follows its own dynamics. The proportion of young people who regularly use e-cigarettes rose again in 2021, particularly among girls. This result confirms the popularity of e-cigarettes among young people (9). Nearly one in six teenagers uses them every day, even though
The specific context of the last two years has led to a stabilization, or even a decrease, in the use of other substances. Boys are known for their greater propensity to expose themselves and take risks (6). However, this study suggests that they may have experienced a greater decrease in consumption than girls, resulting in lower initiation rates for boys than for girls in 2020 and 2021. Further research is needed to better characterize these changes and better understand how the vulnerabilities of adolescent girls and boys are evolving.
Bibliography
1. Kuntsche, E.K. (2005). Why do young people drink? A review of drinking motives. Retrieved from Clinical psychology review: https://doi-org.acces.bibl.ulaval.ca/10.1016/j.cpr.2005.06.002
2. Zuckermann, A.W. (2020). Prevalence and correlates of youth poly-substance use in the COMPASS study. Retrieved from Addictive behaviors: https://doi-org.acces.bibl.ulaval.ca/10.1016/j.addbeh.2020.106400
3. Hawke, L.D. (2020). Impacts of COVID-19 on Youth Mental Health, Substance Use, and Well-being: A Rapid Survey of Clinical and Community Samples. Retrieved from Canadian journal of psychiatry: https://doi-org.acces.bibl.ulaval.ca/10.1177/0706743720940562
4. Dumas, T.M. (2020). What Does Adolescent Substance Use Look Like During the COVID-19 Pandemic? Examining Changes in Frequency, Social Contexts, and Pandemic-Related Predictors. Retrieved from The Journal of adolescent health: official publication of the Society for Adolescent Medicine: https://doi-org.acces.bibl.ulaval.ca/10.1016/j.jadohealth.2020.06.018
5. Leatherdale, S.T. (2021). Examining the impact of the early stages of the COVID-19 pandemic period on youth cannabis use: adjusted annual changes between the pre-COVID and initial COVID-lockdown waves of the COMPASS study. Retrieved from BMC public health: https://doi-org.acces.bibl.ulaval.ca/10.1186/s12889-021-11241-6
6. Gagnon H., RL (2010). The use of psychoactive substances among young Quebecers. Retrieved from Institut national de Santé publique du Québec: https://www.inspq.qc.ca/pdf/publications/1102_UsageSubsPsychoativesJeunes.pdf
7. Leatherdale ST, BK (2014). The COMPASS study: a longitudinal hierarchical research platform for evaluating natural experiments related to changes in school-level programs, policies and built environment resources. Retrieved from BMC Pub Health: https://doi.org/10.1186/1471-2458-14-331
8. Orben, A. T. (2020). The effects of social deprivation on adolescent development and mental health. Retrieved from The Lancet. Child & adolescent health: https://doi-org.acces.bibl.ulaval.ca/10.1016/S2352-4642(20)30186-3
9. Cole, AG, Aleyan, S., Battista, K., & Leatherdale, ST Trends in youth e-cigarette and cigarette use between 2013 and 2019: insights from repeat cross-sectional data from the COMPASS study. 2021.<https://doi-org.acces.bibl.ulaval.ca/10.17269/s41997-020-00389-0>.
Affiliations
Eve Bolduc, Dr. Slim Haddad & Dr. Richard Bélanger, Faculty of Medicine, Laval University and VITAM Research Centre. Claude Bacque Dion, VITAM Research Centre.
The evolution of adolescent mental health during the COVID - 19 pandemic: An analysis of the COMPASS - Québec school cohorts
Link to the report:
Authors: Maxime Giroux, Claude Bacque-Dion, Richard Bélanger & Slim Haddad
Highlights
The proportion of adolescents exhibiting significant depressive symptoms , moderate to severe anxiety levels, or reporting feeling less fulfilled is increasing .
This increase affects different groups of young people , but it particularly affects girls, upper secondary school students, those from more disadvantaged backgrounds or whose family life has been described as less happy.
Adolescent mental health
Mental health problems are a major cause of morbidity and mortality in adolescence (1). Research suggests that the current COVID-19 pandemic may have exacerbated certain pre-existing conditions (2) or even caused the onset of mental health difficulties in the adolescent population (3). Certain personal, school, or family characteristics may predict an increase in mental health problems in some adolescents (4).
What knowledge are we lacking?
How has the mental health of adolescents evolved during the first 18 months of the COVID-19 pandemic? Are certain groups of young people more affected?
What are the objectives and methods?
The study is based on data from the COMPASS longitudinal study in Quebec. The COMPASS-Quebec school cohort project provides a longitudinal profile of the health and well -being of adolescents attending secondary schools in the Capitale-Nationale, Chaudière -Appalaches , and Saguenay -Lac- Saint -Jean regions . All students in participating schools are invited annually to complete the online COMPASS questionnaire.
This study examines data from the 25 schools that participated in the 2019, 2020 , and 2021 survey cycles . The design thus presents responses before the pandemic (March-May 2019), a few months after its onset (May 2020), and one year later (May 2021). The sample comprises 10,727 respondents in 2019, 4,695 in 2020, and 8,462 in 2021.
Mental health measures were self-reported. The three indicators included in this study were the presence of: (i) significant depressive symptoms (a score of 10 or higher on the Centre for Epidemiological Studies Depression Scale Revised (Patte et al., 2017)); (ii) moderate or severe anxiety (a score of 10 or higher on the Generalized Anxiety Disorder 7 (Patte et al., 2017)); and (iii) limited flourishing (a score of 31 or lower on the Flourishing Scale (Patte et al., 2017)). The annual proportion of young people with each of these conditions was adjusted for the main known confounders (sex, grade level , type of school, curriculum , level of family deprivation, and presence of a happy family life). The adjustment was performed using statistical modeling (Poisson regressions). All analyses were conducted using STATA 17 software.
Results
Trends in mental health indicators
The proportion of young people experiencing mental health difficulties decreased slightly in 2020, then increased significantly in 2021 (Figure 1). The presence of significant depressive symptoms increased by 7.3 percentage points (CI : 4.5 %-10.0 %) between the year before and the year after the pandemic , while moderate or severe anxiety increased by 6.8% (CI: 5.2%-8.5%) .

Evolution according to the characteristics of the respondents
Since the results were very similar across the three mental health indicators used, the statistics presented in this section are limited to the evolution of the proportion of young people exhibiting significant depressive symptoms.

Table 1 suggests that girls and upper secondary school students were already showing signs of greater vulnerability before the pandemic. These vulnerabilities were exacerbated afterward . In 2021, half of the female respondents reported significant depressive symptoms ( 50.5 % ; a significant increase of 9.9 percentage points between the beginning and end of the study period), and they were twice as numerous as the male respondents (24.8%; an increase of 4.2 percentage points over the period).
Over 40% of respondents in their third , fourth , or fifth year of secondary school presented significant depressive symptoms, compared to 33.9% among those in their first year of secondary school. However, the progression between the beginning and end of the study period was quite similar between upper secondary students (an increase of over 6.9 percentage points) and lower secondary students (an increase of over 7.7 percentage points).

Table 2 suggests that the presence of significant depressive symptoms is increasing among youth from less disadvantaged families ( CI : 3.9 %–9.6 %) and more disadvantaged families (CI : 5.4%–12.1%) , as well as among adolescents who describe their family as happier (CI: 4.3%–9.7%) or less happy (CI: 3.8%–12.9%). Thus , at the end of the period, one year after the start of the pandemic, more than four-fifths of youth from more disadvantaged families (43%) and more than two-thirds (73%) of respondents who consider their family life less happy exhibit significant depressive symptoms.
The increase in the presence of significant depressive symptoms affects young people in public schools (CI : 4.1 %-10.1 %), private schools (CI : 5.4 %-13.5 %) , and those enrolled in regular programs (CI: 5.1%-9.9%). However, the increase is not statistically significant in the group of young people enrolled in sports-study programs (CI: -2.5%-14.5%).
Boundaries
The research design is not conducive to causal interpretations and calls for cautious inferences. Many events occurred during the 24-month observation period, making it difficult to establish a precise correlation between the students' responses, the course of the pandemic, and the public health measures implemented. Second, the specific circumstances encountered during the spring 2020 round of data collection led the team to modify the data collection process and, consequently, to a decrease in student participation. Although the samples were weighted and analyzed accordingly, selection bias cannot be ruled out. Third, the estimators are adjusted for the main known confounders, but residual confounding remains possible. Finally, the results observed in this cohort of schools located in three regions of Eastern Quebec still need to be confirmed in other contexts.
What can we conclude?
More young people among our participants are experiencing mental health difficulties, whether we consider the presence of significant depressive symptoms, moderate or severe anxiety, or limited personal fulfillment. These results are observed regardless of the respondents' age and gender, whether they attend public or private schools, whether they come from more or less disadvantaged backgrounds, or whether they consider their family life to be more or less happy. The exacerbation of mental health difficulties observed in groups already known to be vulnerable—young girls, adolescents from more disadvantaged families, or those exposed to a less supportive family environment—is particularly concerning and warrants special attention.
Bibliography
1. Chun, TH, Duffy, SJ, & Linakis, JG (2013). Emergency department screening for adolescent mental health disorders: the who, what, when, where, why, and how it could and should be done. Clinical pediatric emergency medicine, 14 (1), 3-11.
2. Golberstein, E., Wen, H., & Miller, B. F. (2020). Coronavirus disease 2019 (COVID-19) and mental health for children and adolescents. JAMA pediatrics, 174 (9), 819-820.
3. Hawke, LD, Barbic, SP, Voineskos, A., Szatmari, P., Cleverley, K., Hayes, E., ... & Henderson, JL (2020). Impacts of COVID-19 on Youth Mental Health, Substance Use, and Well-being: A Rapid Survey of Clinical and Community Samples. The Canadian Journal of Psychiatry, 65 (10), 701-709
4. Magson, N.R. , Freeman, J.Y. , Rapee, R.M., Richardson, C.E. , Oar, E.L. , & Fardouly, J. (2021). Risk and protective factors for prospective changes in adolescent mental health during the COVID-19 pandemic. Journal of youth and adolescence, 50 (1), 44-57.
E-cigarette use among young people during the pandemic: An analysis of COMPASS-Québec school cohorts from 2018 to 2021
Link to the report: E-cigarette use among young people during the pandemic. A COMPASS-Québec school cohort analysis of 2
Highlights
E-cigarette use among young people has decreased since the start of the pandemic, but the proportion of daily users remains stable.
Most daily users say they increased their consumption from the start of the pandemic.
Fewer young people believe that electronic cigarettes pose no or only a slight risk to health.
In 2021, the sources of supply for vaping products are diverse, but mainly focused on purchase when the frequency of use increases.
Context
Recent studies have suggested that e-cigarette use decreased in the months or year following the start of the pandemic [1]. If confirmed, this trend would represent a reversal of the upward trend in vaping observed over the past decade in Quebec, Canada, and elsewhere in the world [2].
Young Canadians primarily report using e - cigarettes because they enjoy them, want to try them , or see them as a way to reduce stress [3]. Age , gender , social environment , and perceived health risks are recognized as influencing e-cigarette use among young people [4]. A more limited or less accessible supply at the beginning of the pandemic, when schools were closed [4], may have contributed to a decrease in e-cigarette use.
Current issues
How has e-cigarette use evolved after the initial restrictions were eased and young people were able to return to school? To what extent do young people associate e-cigarette use with a health risk during the pandemic? What sources of supply did young people have during this period? What do young people say about the influence of the situation on their substance use?
Methods
The analysis is based on data from the COMPASS longitudinal study in Quebec [5]. The study design is based on a repeated cross-sectional analysis in 31 schools that participated in the survey rounds of 2018, 2019, and 2021. Adolescents in the participating schools complete a questionnaire about their behaviors and lifestyle habits in each round. The sample of respondents comprises 15,209, 16,042, and 14,062 young people, respectively.
The consumption measures focus on initiation of e- cigarette use ( lifetime use ) and use in the past 30 days . Considering the number of days e - cigarettes were used in the past month, a distinction is made between daily, regular (6 to 29 days) , and occasional (1 to 5 days ) use. The perceived degree of health risk associated with regular e-cigarette use is categorized into three levels: “no/slight risk,” “moderate risk,” or “high risk.” The 2021 round includes questions on sources of supply, reasons why young people use e-cigarettes, and the influence of the pandemic on their use. A multiple-choice scale reflects the degree of adaptation of young people to the pandemic . Statistics are presented by year. The proportions provided are adjusted for age and sex after weighting the sample to account for response rates by school, age, and sex. All analyses are performed using STATA software.
The 31 participating schools are located in three health regions: Capitale-Nationale (21 schools, 32,670 respondents), Chaudière-Appalaches (4 schools, 6,405 respondents), and Saguenay-Lac-Saint-Jean (6 schools, 6,237 respondents). Two of the 31 schools are private, and four offer only junior high school (grades 7 and 8). The median number of respondents per school was 404 in the 2018 round, 417 in 2019, and 366 in 2021. The main characteristics of the respondents in each round are presented in Table 1.
1. School inclusion criteria: participation in all 3 study rounds and a participation rate of over 20%. Due to a reduced number of participating schools in the 2020 round, which took place two months after the start of the epidemic, the study is limited to the 2018, 2019 and 2021 rounds.
2. The scale is constructed by summatively aggregating responses to six questions in which the young person is asked to rate their nervousness about the current situation, their calmness and relaxation, their concern for their health and that of their family members, their stress about leaving home, and their fear of falling behind in their schoolwork. Respondents are divided into three groups of equal size based on their adaptation score (less well-adjusted, intermediate, and better-adjusted groups).

Evidence gathered
Consumption profile
The adjusted proportion of young people reporting having tried e-cigarettes declined in 2021 and fell below even 2018 levels (Figure 1). These results support observations made at the beginning of the pandemic suggesting a reduction in the number of young people who had started using e-cigarettes [1].

One in five respondents reported using e-cigarettes in the month preceding the third round of the survey (Figure 2). Use within the past 30 days also declined in 2021, particularly among upper secondary school students (Table 2). There were fewer regular and occasional users (-11 percentage points) compared to the last round conducted before the pandemic – 2019. However, there was no decrease in the proportion of young people reporting daily use.


Daily e-cigarette users are typically older, less likely to associate e-cigarettes with health risks, and feel less connected to their schools (Table 3). They are almost 10 times more likely to have started smoking cigarettes and tend to come from less disadvantaged families. These profiles are relatively consistent across survey rounds.

Health risks associated with regular electronic cigarette use
For over 80% of respondents, regular e-cigarette use poses a moderate or high risk to health (Figure 3). Those who believe this practice poses no risk or only a low risk are increasingly fewer; they represent only 16% in the latest round of surveys.
Young people's awareness of the dangers of e-cigarettes is increasing year after year, regardless of usage patterns (Figure 4). Furthermore, the more frequently one vapes, the less likely one is to associate it with a significant health risk. While nearly one in three young people associate regular vaping with a significant health risk (29%), this figure drops to one in six among daily users (14% - adjusted values for 2021).


Reasons why electronic cigarettes are used
Les usagers occasionnels s’adonnent principalement à la cigarette électronique par curiosité alors que les usagers réguliers, et plus encore les usagers quotidiens le font principalement pour les effets que procure la nicotine (Tableau 4). Un usager quotidien sur deux indique recourir à la cigarette électronique pour relaxer ou diminuer le stress. L’attrait des saveurs est invoqué une fois sur trois et pouvoir fumer là où la cigarette n’est pas permise l’est une fois sur cinq. À l’exception des utilisateurs quotidiens de cigarette électronique, la proportion d’utilisateurs vapotant pour arrêter de fumer la cigarette est insignifiante.

Sources d’approvisionnement en période pandémique
On se procure principalement les produits de vapotage en les achetant. (Tableau 5). L’achat est effectué par le jeune lui-même, ou plus souvent, par l’intermédiaire d’un tiers. Dans près d’un cas sur trois, pods et e-liquids sont offerts par un membre de la famille ou un ami. Très peu de jeunes usagers rapportent l’achat par Internet comme source d’approvisionnement. Les utilisateurs réguliers ou quotidiens tendent davantage à acheter/payer pour leurs produits de vapotage alors que les utilisateurs occasionnels se les font plutôt offrir par leur entourage (Figure 5).


Adaptation au contexte pandémique et usage de la cigarette électronique
À la question « Dans quelle mesure ta vie a-t-elle changé en raison de la COVID-19? », 41% des usagers de cigarette électronique répondent que leur consommation est demeurée la même; 49% indiquent qu’elle a augmenté et 11% qu’elle a diminué. Les réponses varient toutefois avec la fréquence d’utilisation (Tableau 6). La majorité (70%) des utilisateurs quotidiens rapportent que leur consommation de cigarette électronique a augmenté. Ils ne sont que 58% parmi les utilisateurs réguliers et moins d’un sur quatre parmi les utilisateurs occasionnels. Le tableau 7 rend compte du degré d’adaptation des jeunes selon leur profil de consommation. Les jeunes déclarant avoir utilisé la cigarette électronique dans les 30 derniers jours tendent à être surreprésentés dans le groupe de répondants s’étant moins bien adapté à la pandémie et conséquemment, sous-représentés dans le groupe des jeunes s’étant mieux adapté.


Limites
La ronde de 2021 a dû être réalisée en ligne. Même si le taux de participation des jeunes se situe à un niveau relativement élevé pour ce type d’enquêtes (moyenne de 78% ; médiane 85%), il varie selon les écoles et demeure en deçà de celui des rondes précédentes. Les échantillons ont été pondérés en conséquence, mais un biais de sélection ne peut être exclu. Deuxièmement, plusieurs changements sont survenus durant la période d’observation, limitant ainsi la capacité à identifier précisément l’origine des changements observés dans l’usage de la cigarette électronique et requérant de prudentes interprétations. Enfin, les résultats observés dans cette cohorte d’écoles situées dans trois régions de l’Est-du-Québec ne sont pas nécessairement illustratifs de la diversité des évolutions pouvant être rencontrées. Les tendances rapportées ici, devront être confirmées par les équipes COMPASS des autres provinces et d’autres recherches longitudinales indépendantes.
Que conclure ?
L’usage de la cigarette électronique chez les jeunes est à la baisse depuis le début de la pandémie. Les jeunes sont globalement moins nombreux à s’être initiés à la cigarette électronique et à l’avoir utilisée dans le dernier mois.
La diminution de l’utilisation de la cigarette électronique observée en 2021 s’accompagne d’une possible réduction des possibilités de vapoter en groupe et d’un accès plus limité aux produits de vapotage[6]. Les jeunes apparaissent par ailleurs plus sensibles aux dangers de la cigarette électronique et il n’est pas exclu qu’au- delà du contexte particulier créé par la pandémie, cette prise de conscience ait pu jouer un rôle dans la baisse de consommation observée.
La part des usagers quotidiens n’a pas diminué d’une année à l’autre ; elle se situe aux environs de 7%. Comme les autres utilisateurs de cigarette électronique, les usagers quotidiens sont surreprésentés parmi les jeunes s’étant moins bien adaptés à la pandémie. Plus des deux tiers d’entre eux disent avoir augmenté leur consommation depuis la survenue du Sars-Cov-2.
Bibliographie
- Hopkins DB, Al-Hamdani M. Young Canadian e-Cigarette Users and the COVID-19 Pandemic: Examining Vaping Behaviors by Pandemic Onset and Gender. Front Public Health. 2021;8:1083.
- National Academies of Sciences, Engineering, and Med- decine 2018. Public Health Consequences of E- Cigarettes. Washington, DC: The National Academies Press. https://doi.org/10.17226/24952
- Government of Canada SC. The Daily — Canadian Tobacco and Nicotine Survey, 2020 [Internet]. 2021 [cité 22 déc 2021]. Disponible sur: https://www150.statcan. gc.ca/n1/daily-quotidien/210317/dq210317b-eng. htm
- Stokes AC. Declines in Electronic Cigarette Use Among US Youth in the Era of COVID-19—A Critical Opportunity to Stop Youth Vaping in Its Tracks. JAMA Netw Open. 1 déc 2020;3(12):e2028221.
- COMPASS [Internet]. Compass System. 2015 [cité 13 déc 2021]. Disponible sur: https://uwaterloo.ca/ compass-system/home
- Dumas TM, Ellis W, Litt DM. What Does Adolescent Substance Use Look Like During the COVID-19 Pandemic? Examining Changes in Frequency, Social Contexts, and Pandemic-Related Predictors. J Ado- lesc Health. 1 sept 2020;67(3):354-61.
Citation suggérée
Gozo JJC, Bélanger RE, Bacque Dion C, Fortier G, Angoa G, Gansaonre RJ, Haddad S. L’usage de la cigarette électronique chez les jeunes en temps de pandémie : analyse des cohortes scolaires COMPASS-Québec de 2018 à 2021. Centre de recherche VITAM. Québec, février 2022.
Auteurs
Jean-Jonathan Cocou Gozo, MD, M.Sc.
Professionnel de recherche, COMPASS-Québec.
Slim Haddad, MD, PhD
Professeur titulaire, Département de médecine sociale et préventive, Faculté de Médecine, Université Laval; Médecin conseil à la Direction régionale de santé publique de la Capitale-Nationale;
Chercheur, Centre de recherche en santé durable (VITAM).
Richard E Bélanger, MD
Pédiatre/Médecin de l’Adolescence, Centre mère-enfant Soleil du CHU de Québec; Professeur agrégé, Département de pédiatrie, Faculté de Médecine, Université Laval; Chercheur associé, Centre de recherche en santé durable (VITAM).
Claude Bacque Dion, MA
Coordonnatrice scientifique, COMPASS-Québec.
Gabrielle Fortier
Étudiante, Faculté de médecine, Université Laval.
Georgina Angoa, MD, M.Sc.
Professionnelle de recherche, COMPASS-Québec.
Rabi Joël Gansaonré, M.Sc.
Doctorant, Faculté de médecine, Université Laval; Gestionnaire et analyste de données, COMPASS-Québec.
Financement
COMPASS-Québec bénéficie d’octrois de recherche et du soutien du Ministère de la Santé et des Services Sociaux, du Gouvernement du Québec, de l’Université Waterloo (Santé Canada – Instituts de Recherche en santé du Canada) et de la Direction régionale de santé publique de la Capitale-Nationale.
Préoccupations environnementales et implication des adolescents dans la lutte aux changements climatiques. Une analyse de la cohorte scolaire COMPASS-Québec 2022
Auteurs :
Gabrielle Fortier, Anne-Marie Turcotte-Tremblay, Claude Bacque Dion, Rabi Joel Gansaonré, Richard Bélanger & Slim Haddad
Faits saillants
- Les préoccupations environnementales interfèrent avec le sommeil ou les travaux d’environ un jeune sur dix. Un jeune sur deux ne s’implique pas dans la réduction des changements climatiques.
- Le sentiment de pouvoir agir contre les changements climatiques est peu développé; près de deux jeunes sur trois croient ne pas pouvoir faire quelque chose pour réduire ces changements.
- Parmi les jeunes qui s’impliquent davantage dans la lutte contre les changements climatiques figurent davantage de filles, de jeunes qui ne s’identifient ni comme une fille, ni comme un garçon, de jeunes plus anxieux ou entretenant de bonnes relations avec l’école et la famille.
- Les jeunes qui ont le sentiment de pouvoir agir sur les changements climatiques sont aussi ceux qui essaient davantage de réduire les comportements contribuant aux changements climatiques.
Les changements climatiques et les adolescents
Peu de travaux à ce jour ont été effectués auprès des adolescents (1). Une étude récente a montré que les préoccupations liées aux changements climatiques touchent une proportion importante des jeunes entre 16 et 25 ans dans le monde (2). En plus des jeunes, il semblerait que les femmes et ceux vivants dans des régions plus vulnérables sont particulièrement préoccupés par les changements climatiques (3).
Les stratégies d’adaptation utilisées par les jeunes face à leurs préoccupations environnementales peuvent les mener soit à adopter des comportements réduisant les changements climatiques ou, à l’opposé, à éviter le problème. Les études actuelles suggèrent que l’espoir face aux changements climatiques et au futur augmente les comportements pro-environnementaux, en plus de diminuer le risque d’avoir des préoccupations qui affectent le bien-être du jeune (4). Une récente recension des écrits suggère qu’une éducation axée sur les actions concrètes, des actions collectives et des discussions ouvertes sur le problème pourraient amener les jeunes à s’impliquer dans la lutte aux changements climatiques (1). Mieux comprendre l’expérience des jeunes par rapport aux changements climatiques permettrait de les outiller plus efficacement face à cette menace.
De quelles connaissances manque-t-on ?
Quelle est la part des jeunes qui se disent préoccupés par les changements climatiques ? Y a-t-il des groupes qui le sont davantage ? Comment les préoccupations environnementales sont associées avec différents marqueurs de bien-être, comme l’anxiété et le rapport avec l‘environnement familial ou scolaire ? Est-ce que les adolescents s’impliquent dans la lutte contre les changements climatiques ? Qui sont les jeunes non impliqués dans cette lutte ? Est-ce que les préoccupations déterminent le niveau d’implication environnementale ?
Quels sont les objectifs et les méthodes ?
L’analyse repose sur les données de l’étude longitudinale COMPASS au Québec. Chaque année, les jeunes des écoles secondaires participantes sont invités à répondre à un questionnaire portant sur leurs habitudes de vie et leurs comportements (5). Le devis d’étude repose sur les données de la ronde de 2022 réalisée dans 113 écoles du Québec. L’échantillon est constitué de 48 289 jeunes provenant des régions de la Capitale-Nationale (38 écoles, 24 985 répondants), de Chaudière-Appalaches (21 écoles, 11 300 répondants), du Saguenay-Lac-St-Jean (8 écoles, 2 763 répondants), du Bas-St-Laurent (28 écoles, 6 730 répondants), de la Côte-Nord (16 écoles, 1 915 répondants) et de la Gaspésie (2 écoles, 596 répondants).
Les mesures sur l’expérience du changement climatique sont extraites de Clayton et Karazsia (6). Deux questions portent sur les préoccupations des jeunes. L’une traite de l’incidence des changements climatiques sur leur sommeil et l’autre sur la capacité à accomplir leurs travaux. Deux autres questions traitent de l’implication des jeunes. La première concerne le pouvoir d’agir (est-ce qu’il croit pouvoir faire quelque chose pour lutter contre le changement climatique); la seconde les comportements (est-ce qu’il essaie de réduire ses comportements qui y contribuent).
Les variables de stratification sont l’âge, le genre, le statut socio-économique familial (plus défavorisé vs moins défavorisé), le type d’école fréquenté et la région où est localisée l’école (urbain ou rural). L’expérience du changement climatique est contrastée avec quatre marqueurs de bien-être; (i) la présence d’un niveau d’anxiété modéré ou sévère (7); (ii) une adaptation à la pandémie limitée (8); (iii) un sentiment d’appartenance à l’école plus fort (9) et (iv) la possibilité de parler de ses problèmes avec sa famille. Les données sont pondérées pour chaque école en fonction des taux de réponse selon âge et le sexe. Les proportions et ratios de risques ont été ajustés pour les principaux confondants (âge, genre, type d’école, niveau de défavorisation familial et région où est localisée l’école). L’ajustement a été réalisé par modélisation statistique (régression de Poisson). Toutes les analyses sont réalisées avec le logiciel STATA17©.
Résultats
La proportion de jeunes pour qui les changements climatiques interfèrent parfois ou souvent avec leur
sommeil est de 9%. Ils sont 6% à indiquer qu’ils interfèrent parfois ou souvent avec leur capacité à effectuer leurs travaux (Figure 1). Près de deux jeunes sur trois ne croient pas pouvoir faire quelque chose pour réduire les changements climatiques. Un peu plus de la moitié des jeunes déclare ne pas essayer ou essayer rarement de réduire ses comportements qui contribuent aux changements climatiques.

Préoccupations environnementales interférant avec la vie des jeunes
The presence of environmental concerns interfering with a young person's life is defined here by a positive response to whether sometimes, often, or almost always thinking about climate change prevents them from sleeping or doing their schoolwork. The presence of environmental concerns interfering with respondents' lives is not associated with their age, the type of school attended, or its location (Table 1 and Figure 2). Compared to boys, the incidence of environmental concerns is more pronounced among girls (RR = 1.53; 95% CI [1.43, 1.64]) and young people who do not identify with either gender (RR = 2.80; 95% CI [2.53, 3.09]). Environmental concerns also interfere more with the lives of young people from more disadvantaged backgrounds than those from less disadvantaged backgrounds (RR = 1.49; 95% CI [1.40, 1.58]).


The relationship between the interference of environmental concerns in young people's lives and markers of well-being is illustrated in Table 2 and Figure 3. Overall, environmental concerns interfere less in the lives of young people who are well-balanced or have a good relationship with their environment. Climate change interferes more with sleep or the ability to do schoolwork among young people who are more anxious or less well-adjusted to the pandemic (RR = 1.98; 95% CI [1.86; 2.12] and RR = 2.09; 95% CI [1.97; 2.22], respectively). Conversely, environmental concerns interfere less in the lives of young people who have a closer relationship with their family (RR = 0.82; 95% CI [0.78; 0.87]). Interference is also less among those who have a stronger sense of belonging to their school (RR= 0.76; CI95[0.71 ; 0.81]).


Environmental implications
Adolescents aged 15 and older are more likely to believe they can contribute to reducing climate change (RR = 1.19; 95% CI [1.14; 1.24]) and are more likely to try to change their behavior (RR = 1.17; 95% CI [1.12; 1.21]) than those aged 14 and younger (Table 3 and Figure 4). Empowerment and behavioral change are more common among girls than boys (RR = 1.23; 95% CI [1.20; 1.27] and RR = 1.17; 95% CI [1.14; 1.22], respectively) and among young people who do not identify with either gender (RR = 1.26; 95% CI [1.19; 1.34] and RR = 1.22; 95% CI [1.15; 1.29], respectively, compared with boys). Young people attending private schools are also more likely to believe they can contribute to the fight against climate change and to try to change their behavior (RR = 1.19; 95% CI [1.06, 1.35] and RR = 1.15; 95% CI [1.02, 1.28], respectively). Attending a school in an urban area increases the likelihood of trying to reduce behaviors that contribute to climate change (RR = 1.12; 95% CI [1.02, 1.23]), but is not associated with the belief that they can do something to help. Family socioeconomic status is not associated with young people's environmental involvement.


The various markers of young people's well-being are similar between those who try to change and those who believe they can contribute to the fight against global warming (Table 4 and Figure 5). More anxious young people are more likely to believe they can do something and try to modify their behavior (RR = 1.06; 95% CI [1.02; 1.10] and RR = 1.12; 95% CI [1.09; 1.16], respectively). The feeling of empowerment and the willingness to change behavior are more pronounced among young people who have a stronger sense of belonging to their school (RR = 1.30; 95% CI [1.27; 1.33] and RR = 1.13; 95% CI [1.11; 1.16], respectively). Finally, if adolescents with a close connection to their family do not try harder to change their behavior, they more frequently believe they can do something (RR = 1.14; 95% CI [1.11; 1.17]).


Among young people for whom environmental concerns are less important in their lives, 31% believe they can do something and 40% try to change their behavior (Table 5). Among those whose concerns interfere with their sleep or schoolwork, 60% believe they can take action, and 71% try to reduce their behavior. The feeling of being able to act on climate change is almost twice as high among adolescents whose environmental concerns interfere with their sleep or schoolwork (RR = 1.91; 95% CI [1.82; 2.00]. They are also more likely to try to change their behavior (RR = 1.78; 95% CI [1.71; 1.86]).

Figure 6 illustrates the role of agency in young people's willingness to reduce their contribution
to climate change. A majority of young people who believe they can help reduce climate change try to change their behavior. Among those who feel their agency is more limited, barely a quarter (16.3% vs. 48.8%) try to change behaviors that could contribute to climate change.

Boundaries
The analysis of young people's concerns and their engagement in the fight against climate change is based on the four indicators available in the 2022 COMPASS survey. These measures are extracted from a more extensive questionnaire (6) and therefore provide only a preliminary, and necessarily incomplete, overview of secondary school students' attitudes toward climate change. Further research is needed to better understand these realities. A second limitation lies in the identification, also still preliminary, of the factors that predispose young people or encourage them to believe they can be agents of change. A third limitation lies in
the study population. The 2022 COMPASS study covered six regions of Eastern Quebec. Although the results appear very similar from one study area to another, it is possible that they could differ in other contexts.
What can we conclude?
About one in ten young people report that thinking about climate change interferes with their sleep or schoolwork. One in three believes they can do something to combat climate change, and slightly less than half try to change their behavior. Girls, young people who do not identify as male or female, and those who are more anxious are more concerned and more involved in the fight against climate change. Teenagers from more disadvantaged backgrounds are more concerned but not more involved. A young person with a good relationship with their family and school environment appears both less concerned and more involved in the fight against climate change. Future research could further explore the link between a young person's relationship with their environment and their attitude toward the climate crisis.
Young people who try to change their behavior are also those who feel more empowered to take action against climate change. Raising awareness among teenagers about climate change so they feel involved and believe in their ability to act, without disrupting their sleep or schoolwork, is a promising avenue to explore to encourage them to engage constructively in the fight against climate change.
Bibliography
- Crandon, T. J., Scott, J. G., Charlson, F. J., & Thomas, H. J. (2022). A social–ecological perspective on climate anxiety in children and adolescents. Nature Climate Change, 12(2), 123-131.
- Hickman, C., Marks, E., Pihkala, P., Clayton, S., Lewandowski, R. E., Mayall, E. E., Wray, B., Mellor, C., & van Susteren, L. (2021). Climate anxiety in children and young people and their beliefs about government responses to climate change: a global survey. Lancet Planetary Health, 5(12), E863-E873.
- Gousse-Lessard, A.-S., & Lebrun-Paré, F. (2022). Regards croisés sur le phénomène « d’écoanxiété » : perspectives psychologique, sociale et éducationnelle. Éducation relative à l’environnement.
- Ojala, M. (2012). Regulating Worry, Promoting Hope: How Do Children, Adolescents, and Young Adults Cope with Climate Change? International Journal of Environmental and Science Education, 7(4), 537-561.
- Leatherdale, S. T., Brown, K. S., Carson, V., Childs, R. A., Dubin, J. A., Elliott, S. J., Faulkner, G., Hammond, D., Manske, S., Sabiston, C. M., Laxer, R. E., Bredin, C., & Thompson-Haile, A. (2014). The COMPASS study: a longitudinal hierarchical research platform for evaluating natural experiments related to changes in school-level programs, policies and built environment resources. BMC Public Health, 14(1), 331.
- Clayton, S., & Karazsia, B. T. (2020). Development and validation of a measure of climate change anxiety.Journal of Environmental Psychology, 69, Article 101434.
- Spitzer, R. L., Kroenke, K., Williams, J. B., & Löwe, B. (2006). A brief measure for assessing generalized anxiety disorder: the GAD-7. Arch Intern Med, 166(10), 1092-1097.
- Gozo JJC, Bélanger RE, Bacque Dion C, Fortier G, Angoa G, Gansaonre RJ, Haddad S. (2022). L’usage de la cigarette électronique chez les jeunes en temps de pandémie : analyse des cohortes scolaires COMPASS Québec de 2018 à 2021. Centre de recherche VITAM. Québec.
- Katapally TR, Thorisdottir AS, Laxer R, Leatherdale ST. (2018). Association entre le sentiment d’appartenance à l’école, la participation à l’intimidation et divers comportements associés au temps passé devant un écran chez les jeunes dans deux provinces canadiennes: Une étude COMPASS. Heal Promot chronic Dis Prev Can Res policy Pract, 8:368–79.
Citation suggérée
Fortier G, Turcotte-Tremblay A-M, Bacque-Dion C, Gansaonre RJ, Bélanger RE, Haddad S. Préoccupations environnementales et implication des adolescents dans la lutte aux changements climatiques; Une analyse de la cohorte scolaire COMPASS-Québec 2022. Centre de recherche VITAM. Québec, septembre 2022.
Financement
COMPASS-Québec bénéficie d’octrois de recherche et du soutien du Ministère de la Santé et des Services Sociaux, du Gouvernement du Québec, de l’Université Waterloo (Santé Canada – Instituts de Recherche en santé du Canada) et de la Direction régionale de santé publique de la Capitale-Nationale.
La santé mentale des jeunes du secondaire se dégrade et les inégalités se creusent. Analyse des cohortes scolaires de COMPASS-Québec de 2018 à 2022
Auteurs
Krystel Poirier, Richard Bélanger, Claude Bacque-Dion, Rabi Joel Gansaonre, Anne-Marie Turcotte-Tremblay, Michel Lucas & Slim Haddad
Highlights
- Young people's mental health is deteriorating. The negative trend in mental health indicators affects all young people, regardless of their age, gender, social background, or school location. Young women and young people from disadvantaged families are the most vulnerable, both in terms of the proportion of young people reporting mental health difficulties and the extent of the decline in their mental health.
- All participating schools in the regions covered by the study faced a rapid and substantial increase in the mental health needs of their young girls.
The COVID-19 pandemic and adolescent mental health
The outbreak of the COVID-19 pandemic in the winter of 2020 led to school closures and the implementation of various forms of social distancing. After an initial period during which young people seemed to adapt to preventive measures (1, 2), several studies report an increase in stress levels and a decline in their mental health (3-6). Young people with pre-existing mental health difficulties (3-5), girls (7-9), older adolescents (7, 8), and those from more disadvantaged backgrounds (6) appear to be more frequently affected. Some recently published studies suggest that adolescent mental health continued to deteriorate despite the lifting of several public health restrictions (7, 8).
What knowledge are we lacking?
This study examines the evolution of mental health among a population of young people in Eastern Quebec between 2018 and 2022. It aims to determine the extent to which their mental health has deteriorated since the onset of the health crisis and seeks to answer the following three questions: (i) How has the proportion of young people experiencing difficulties changed? (ii) To what extent has the condition of young people with mental health difficulties worsened? (iii) To what extent have inequalities in mental health increased?
What methods are used?
Quotes and measurements
This study uses data from the COMPASS-Québec school cohort study on adolescent health and well-being. The research design is a repeated cross-sectional design. The sample consists of respondents from the 33 schools that participated in the two annual rounds preceding the health crisis (2018 and 2019) and the 2021 and 2022 rounds, conducted 12 to 15 months and 24 to 27 months, respectively, after the start of the health crisis. The participating schools are located in three regions of Eastern Quebec (Capitale-Nationale, Chaudière-Appalaches, and Saguenay-Lac-Saint-Jean).
All students in schools are invited to participate in the annual surveys. There were 14,944 respondents in 2018, 15,462 in 2019, 12,008 in 2021, and 14,385 in 2022. Mental health assessments are based on previously validated self-reported scales. The Centre for Epidemiological Studies Depression Scale Revised (CESD-R-10) reports on the presence of depressive symptoms (10-12). Anxiety levels are measured by the Generalized Anxiety Disorder-7 Item Scale (GAD-7) (13, 14), and feelings of well-being by the Flourishing Scale (15). The CESD-R-10 and GAD-7 scores were reverse-ordered from most to least vulnerable. Threshold values are used to identify students experiencing difficulties with respect to each of these indicators. Significant depressive symptoms are present when the score on the reverse CESD-R-10 is 20 out of 30 or less (15). Anxiety is moderate to severe when the score on the reverse GAD-7 is 11 out of 21 or less. Finally, a young person is considered to be in the less well-being group if their well-being score is at or below the median value, which is 32 out of 40.
Evolving needs and inequalities among young people
Statistical methods are derived from approaches used for the analysis of poverty and social inequality, adapted to the health sector (16). Figure 1 illustrates their foundations. Suppose we are interested in the (hypothetical) responses of a population to a questionnaire on the presence of depressive symptoms (CESD-R-10). Respondents are first ordered according to their mental health, starting with those who present the most significant depressive symptoms and ending with those who present the fewest. In other words, respondents are ranked in ascending order of their inverse CESD-R-10 score. The inverse score ranges from 5 to 30. The data set is then divided into 100 groups (percentiles) composed of an equal number of individuals. Thus, ten percent of respondents have a positive mental health score (reverse score) below the 10th percentile, 50% have a score below the median, etc.

Le trait bleu réunit les valeurs du score moyen de chaque percentile de la population. On constate qu’environ 10 % de la population présente un score de santé mentale positive inférieur à 10, que la moitié des répondants ont un score supérieur à 22 et que le score excède 25 sur 30 dans le dernier décile de répondants. Tous les jeunes dont le score inversé est inférieur à 20 présentent des symptômes dépressifs significatifs (rappelons qu’une valeur au CESDR- 10 supérieure ou égale à 10 définit la présence de symptômes dépressifs significatifs). Le trait horizontal rouge, qu’on qualifie (17) de ligne de pauvreté de santé, permet donc de distinguer la section de la distribution incluant des jeunes présentant des difficultés de santé mentale (courbe située en deçà de la ligne de pauvreté de santé) de celle incluant des jeunes ne présentant pas de difficultés. Les répondants en A, B et C font partie du premier groupe et D, du second.
Évolution de la proportion de jeunes en difficulté (incidence de la pauvreté de santé) : La proportion de jeunes en difficulté est donnée par la valeur de l’abscisse du point d’intersection entre la ligne de pauvreté de santé et la courbe réunissant les valeurs du score moyen de chaque percentile. Ainsi la proportion de jeunes présentant des difficultés de santé mentale, ou selon la terminologie consacrée, l’incidence de la pauvreté de santé ou l’incidence du besoin, est de 42 %.
Gravité de la condition des jeunes en difficulté (profondeur de la pauvreté de santé) : Les jeunes en difficulté se situent entre le premier et le 43e percentile. Comme on peut le constater, le niveau de vulnérabilité des jeunes présentant des difficultés de santé mentale diffère sensiblement. Le score moyen des individus du groupe A est d’environ 10. Il se situe à 10 points de la valeur seuil (-100 %). Le score moyen des répondants en C est de 17. Il est inférieur de 3 points à la valeur seuil (-15 %). Plus le score moyen des jeunes en difficulté s’éloigne de la valeur seuil, et plus préoccupante est leur condition et vice-versa. En d’autres termes, plus la surface de l’aire représentée en vert à la figure 1 est importante, et plus préoccupante est la condition générale du sous-échantillon de jeunes présentant des difficultés. Un accroissement de cette surface d’une année à l’autre signe une détérioration de la condition moyenne des jeunes présentant des difficultés de santé mentale. Selon la terminologie consacrée, la profondeur de la pauvreté de santé (ou profondeur du besoin de santé) serait en augmentation.
L’incidence et la profondeur du besoin de santé peuvent être dérivées algébriquement plutôt que graphiquement, par les indices de Foster-Greer-Thorbecke (FGT) (18). L’incidence du besoin ou FGT (0) est le rapport du nombre de cas de jeunes en difficulté sur la population totale. La profondeur du besoin ou FGT (1) correspond à l’écart moyen entre le score des jeunes en difficulté et la valeur seuil choisie. L’indice FGT (1) est exprimé en valeur relative. Il augmente lorsque le score moyen des jeunes en difficulté tend à s’éloigner de la valeur seuil. Une stratification de ces indices selon le sexe, l’âge et le niveau de défavorisation familiale des jeunes sera réalisée afin d’identifier d’éventuelles « sur-vulnérabilités ».
Inégalité de santé mentale : L’inégalité de santé est plus complexe à appréhender graphiquement. Elle est plutôt estimée algébriquement par un indice reflétant l’inégalité de la distribution ; l’indice de Gini (19). Il s’agit d’une mesure standardisée évoluant dans l’intervalle [0,1]. Une valeur nulle de l’indice de Gini indiquerait une distribution parfaitement égalitaire. Plus l’inégalité est prononcée dans la distribution et plus la valeur de l’indice se rapproche de l’unité. Une augmentation de l’indice d’une année à l’autre traduit un accroissement de l’inégalité.
Résultats
Évolution des besoins et de l’inégalité en santé mentale
La figure 2 fournit une vision d’ensemble de l’évolution de l’intensité des besoins de santé mentale, de la profondeur des besoins et de l’inégalité. La figure 3 présente pour chacun des estimateurs, la différence entre les rondes précédant le déclenchement de la crise (2018-2019), la différence entre la ronde précédant la crise et celle réalisée environ un an après son déclenchement (2019-2021) et la différence sur l’ensemble de la période d’observation (2018-2022).


Besoin de santé mentale
La santé mentale des jeunes s’est dégradée sensiblement pendant la période d’observation (figure 2). La proportion de jeunes présentant des symptômes dépressifs significatifs était en légère augmentation entre les deux rondes précédant la pandémie, de même que la proportion des jeunes modérément ou sévèrement anxieux. La tendance s’est ensuite nettement accentuée entre la ronde précédant la crise sanitaire et celle de 2021. La proportion de jeunes présentant des symptômes dépressifs significatifs est passée de 26,7 % IC95%[25,9 %, 27,4 %] en 2019 à 37,4 % IC95%[36,5 %, 38,3 %] en 2021, soit une augmentation de plus de 10 points de pourcentage (10,7 % IC95%[9,6 %, 11,9 %]). Au cours de cette même période, la proportion de jeunes modérément ou sévèrement anxieux a progressé de près de 8 points de pourcentage (7,8 % IC95%[6,9 %, 8,8 %]) et celle des jeunes se disant moins épanouis de 7 points de pourcentage (7,4 % IC95%[6,2 %, 8,5 %]).
The proportion of less fulfilled young people and the proportion of anxious young people continued to rise in 2022 (Figure 2). Just over two years after the start of the health crisis, one in four young people exhibits symptoms of moderate to severe anxiety (24.7%, 95% CI [24.0%, 25.4%]), and nearly one in two is in the less fulfilled group (44.6%, 95% CI [43.8%, 45.4%]). More than one in three young people exhibits significant depressive symptoms (37.1%, 95% CI [36.3%, 37.9%]).
Over the four years, the proportion of young people with significant depressive symptoms increased by 14.5 percentage points (a relative increase of 64%), that of anxious young people by 11.2 percentage points (a relative increase of 88%), and that of less fulfilled young people by 10.7 percentage points (a relative increase of 31%).
Depth of the mental health needs of troubled youth
The FGT index value (1) increased over the entire period (Figure 2). The symptoms of young people with depressive symptoms tended to become more pronounced, and their score on the reverse CESD-R-10 tended to move further away from the reference threshold. The depth of mental health need estimated via the reverse CESD-R-10 doubled during the observation period. It stood at 6.5% of the threshold value in 2018 (95% CI [6.2%, 6.8%]) and 12.3% (95% CI [11.9%, 12.6%]) in 2022. The depth of health need estimated by the anxiety score also doubled, increasing from 5.6% (95% CI [5.4%, 5.9%]) to 11.6% (95% CI [11.2%, 12.0%]). The depth of need in relation to the feeling of fulfillment increases from 5.0% CI95%[4.8%, 5.2%] to 8.1% CI95%[7.9%, 8.4%].
Mental health inequality
Mental health inequality was relatively contained in 2018 and 2019, with the Gini index for all three indicators around 0.10. Mental health inequality has increased somewhat since the round following the outbreak of the health crisis (Figure 2). The Gini index for depressive symptoms was 0.143 (95% CI [0.141, 0.146]) in 2019 and 0.176 (95% CI [0.176, 0.183]) in 2021, an increase of 0.036 points (95% CI [0.032, 0.041]). The Gini index value for moderate to severe anxiety increased from 0.166 (95% CI [0.163, 0.169]) to 0.210 (95% CI [0.206, 0.214]) during the same period. It increased for the indicator of least flourishing from 0.092 (95% CI [0.190, 0.093]) to 0.105 (95% CI [0.103, 0.107]).
Gender-specific vulnerabilities and mental health inequalities
The curves presented in Figures 4 and 5 illustrate the year-over-year progression of the FGT(0) and FGT(1) indices in four subgroups defined according to the respondents' sex and their level of family deprivation. To limit the number of graphs, only the results concerning depressive symptoms and anxiety are presented.


A decline in young people's mental health is observed across all age groups. In 2022, more young people experienced mental health difficulties, regardless of age. The mental health needs of young girls exceed those of young boys. The deterioration in their condition is more pronounced and consistent year after year among female respondents. Belonging to a more disadvantaged family is also associated with the presence of significant depressive symptoms or moderate to severe anxiety.
More than half of the respondents aged over 15 from disadvantaged families presented significant depressive symptoms in the last round of data collection. This figure was only 40% at the beginning of the observation period. A teenage girl living in a more disadvantaged family environment appears to be doubly disadvantaged. It is possible that the health crisis exacerbated existing inequalities by disproportionately affecting teenage girls from more disadvantaged families.


The examination of the depth of mental health need (DHS (1)) reveals a similar picture (Figures 5a, 5b). The situation of at-risk youth deteriorated during the observation period. Here again, girls, and even more so those from more disadvantaged backgrounds, are more affected. The depth of mental health need increased during the two rounds of assessment conducted after the start of the health crisis. From age 15 onward, for both depression and anxiety, the depth of mental health need for these doubly disadvantaged girls exceeded the threshold value by nearly 25%.
Exposure of schools to evolving mental health needs
Figure 6 shows the annual change in the proportion of girls experiencing mental health difficulties in a subsample of 27 secondary schools. Each data set corresponds to one observation round. Table 1 presents the results in more detail.
The increasing mental health needs of school-aged children are reflected in the aggregate statistics by school. The proportion of girls experiencing difficulties is rising year after year across all schools. The trends shown in Figure 6 suggest that the health crisis is associated with an exacerbation of these needs. The proportion of girls exhibiting significant depressive symptoms varies from 43.4% to 69.3% depending on the school (with an average of 54.8%). In 21 of the 27 schools, at least half of the girls present significant depressive symptoms, compared to only one school in 2018. An examination of the two other mental health indicators provides a similar picture.


Boundaries
The design is a repeated cross-sectional study, which limits the possibility of examining the individual trajectories of young people and identifying the potential impacts of the health crisis on their health. Since the sample consists of secondary schools from three regions of Eastern Quebec, the possibility that needs may have evolved differently in contexts where young people are exposed to other realities cannot be ruled out. Finally, the analysis focuses on two recognized sources of vulnerability: gender and socioeconomic disadvantage among young people's families. Further research will be needed to better understand the main determinants of young people's needs and the sources of vulnerability among adolescent populations.
What can we conclude?
The mental health of young people deteriorated throughout the four years of observation. This trend worsened the year following the start of the health crisis. More young people presented significant depressive symptoms, signs of moderate to severe anxiety, and a larger proportion of them were among the least well-adjusted youth. The condition of young people experiencing mental health difficulties tended to be more severe.
The health crisis has likely exacerbated mental health needs and amplified inequalities. The decline in mental health among young people is observed across all social groups, regardless of age, gender, or family socioeconomic status. The situation of adolescent girls, and especially those living in disadvantaged families, appears particularly concerning.
High schools, school service centres, community organizations, clinical services, and regional public health authorities that support adolescents are all grappling with this new reality. And while all schools are affected, some have a higher concentration of at-risk youth.
School provides a privileged environment for promoting the mental health of young people and combating
health inequalities.
Suggested quote
Poirier K, Bélanger RE, Bacque Dion C, Gansaonre, RJ, Turcotte-Tremblay AM, Lucas M, Haddad S. The mental health of high school students is deteriorating and inequalities are widening. Analysis of COMPASS-Québec school cohorts from 2018 to 2022. VITAM Research Centre. Quebec City, September 2022.
Funding
COMPASS-Québec benefits from research grants and support from the Ministry of Health and Social Services, the Government of Quebec and the University of Waterloo (Health Canada – Canadian Institutes of Health Research).
Bibliography
- Giroux M, Bacque-Dion C, Bélanger R, Haddad S. The evolution of adolescent mental health during the COVID-19 pandemic. An analysis of the COMPASS-Québec school cohorts. COMPASS Québec 2021.
- Bélanger RE, Patte KA, Leatherdale ST, Gansaonré RJ, Haddad S. An Impact Analysis of the Early Months of the COVID-19 Pandemic on Mental Health in a Prospective Cohort of Canadian Adolescents. J Adolesc Health. 2021;69(6):917-924. doi:10.1016/j.jadohealth.2021.07.039
- Li, SH, Beames, JR, Newby, JM, Maston, K., Christensen, H., Werner-Seidler, A., 2021. The
impact of COVID-19 on the lives and mental health of Australian adolescents. European Child & Adolescent Psychiatry.. doi:10.1007/s00787-021-01790-x - Pieh, C., Dale, R., Plener, PL, Humer, E., Probst, T., 2021. Stress levels in high-school students after a semester of home-schooling. European Child & Adolescent Psychiatry. doi:10.1007/s00787-021-01826-2
- Cost, KT, Crosbie, J., Anagnostou, E., Birken, CS, Charach, A., Monga, S., Kelley, E., Nicolson, R., Maguire, JL, Burton, CL, Schachar, RJ, Arnold, PD, Korczak, DJ, 2022. Mostly worse, occasionally better: impact of COVID-19 pandemic on the mental health of Canadian children and adolescents. European Child & Adolescent Psychiatry 31, 671–684. doi:10.1007/s00787-021-01744-3
- Regional Health-Europe TL. Protecting the mental health of youth. Lancet Reg Health Eur. 2022;12:100306. Published 2022 Jan 10. doi:10.1016/j.lanepe. 2021.100306
- Radhakrishnan L, Leeb RT, Bitsko RH, Carey K, Gates A, Holland KM, et al. Pediatric Emergency Department Visits Associated with Mental Health Conditions Before and During the COVID-19 Pandemic - United States, January 2019-January 2022. MMWR Morb Mortal Wkly Rep. 2022;71(8):319-24.
- von Soest T, Kozák M, Rodríguez-Cano R, Fluit DH, Cortés-García L, Ulset VS, et al. Adolescents' psychosocial well-being one year after the outbreak of the COVID-19 pandemic in Norway. Nat Hum Behav. 2022;6(2):217-28.
- Magson, NR, Freeman, JYA, Rapee, RM, Richardson, CE, Oar, EL, Fardouly, J., 2021. Risk and Protective Factors for Prospective Changes in Adolescent Mental Health during the COVID-19 Pandemic. Journal of Youth and Adolescence 50, 44–57. doi:10.1007/s10964-020-01332-9
- Andresen EM, Malmgren JA, Carter WB, Patrick DL. Screening for depression in older adults: evaluation of a short form of the CES-D (Center for Epidemiologic Studies Depression Scale). Am J Prev Med. 1994;10(2):77-84.
- Haroz EE, Ybarra ML, Eaton WW. Psychometric evaluation of a self-report scale to measure adolescent depression: the CESDR-10 in two national adolescent samples in the United States. J Affect Disord. 2014;158:154-60.12. Zhang W, O'Brien N, Forrest JI, Salters KA, Patterson TL, Montaner JS, et al. Validating a shortened depression scale (10 item CES-D) among HIV-positive people in British Columbia, Canada. PLoS One. 2012;7(7):e40793.
- Spitzer RL, Kroenke K, Williams JB, Löwe B. A brief measure for assessing generalized anxiety disorder: the GAD-7. Arch Intern Med. 2006;166(10):1092-7.
- Tiirikainen K, Haravuori H, Ranta K, Kaltiala-Heino R, Marttunen M. Psychometric properties of the 7-item Generalized Anxiety Disorder Scale (GAD-7) in a large representative sample of Finnish adolescents. Psychiatry Res. 2019;272:30-5.
- Patte KA, Bredin C, Henderson J, Elton-Marshall T, Faulkner G, Sabiston C, et al. Part 1: Tool development and design. COMPASS; 2017.
- Clarke P, Erreygers G. Defining and measuring health poverty. Soc Sci Med. 2020;244:112633.
doi:10.1016/j.socscimed.2019.112633. - Ravallion, M. Poverty lines in theory and practice. World Bank Publications, 1998.
- Foster J, Greer J, Thorbecke E. A Class of Decomposable Poverty Measures. Econometrica.
1984;54(3):761-6. - Gastwirth JL. The Estimation of the Lorenz Curve and Gini Index. The Review of Economics and Statistics. 1972;54(3):306-16.
Cessation of electronic cigarette use among adolescents. Attempts to quit and barriers encountered. An analysis of the COMPASS-Québec school cohorts (2022-2023).
Authors
Rosalie Bouchard, Anne-Marie Turcotte-Tremblay, Richard Bélanger, Claude Bacque-Dion & Slim Haddad
Highlights
- Nearly half (45%) of young people who have used e-cigarettes report having tried to quit. These attempts are more frequent among regular or daily e-cigarette users who believe that e-cigarettes may pose health risks.
- Eight out of 10 young people say they have encountered difficulties when trying to quit vaping. Addiction to e-cigarettes, the feeling of being less in control of their mood, the fear of not being able to quit vaping, and not knowing how to quit are the most frequently cited barriers.
- More barriers are reported by more anxious young people and girls. Girls cite weight gain as a barrier to quitting twice as often as boys.
- Thirty-six percent of young people who tried to quit using e-cigarettes abstained from them in the last 30 days. The proportion of abstainers drops significantly as soon as obstacles are encountered during attempts to quit e-cigarettes.
Recommendations
- Promote the cessation of electronic cigarette use by paying attention to the barriers that young people encounter when they try to quit.
- Pay particular attention to barriers related to tobacco product addiction, emotion management, and empowerment.
- Design interventions that are sensitive to the specific needs of groups who have more difficulty quitting electronic cigarettes.
- Continue research aimed at formulating and deploying effective and appropriate intervention strategies in school settings.
Vaping among teenagers
E-cigarettes are now the most popular tobacco product among teenagers . <sup>1</sup> Most e-cigarettes used by teenagers contain nicotine,<sup> 2 </sup> a substance that affects the still-developing brain of young people .<sup> 3 </sup> Nicotine addiction occurs more quickly in teenagers and with smaller amounts than in adults,<sup> 4</sup> and nicotine likely increases the risk of addiction to other substances .<sup> 5 </sup> Vaping liquids also contain solvents, flavorings, and even other psychoactive substances whose long-term health effects are not yet fully understood, but which could be involved in the onset or exacerbation of respiratory illnesses.
The 2022 COMPASS-Québec survey shows that more than a third (34%) of young people have already tried e-cigarettes.<sup> 6 </sup> Nearly one in five young people had vaped in the 30 days preceding the survey, and more than one in twenty vaped daily (6%). A recent study reports that 42% of young Canadians who vaped in the previous month describe themselves as "somewhat" or "very dependent" on e-cigarettes . <sup> 7</sup>
What knowledge are we lacking?
Vaping is a recent phenomenon, and little is known about how young people quit using e-cigarettes. How many have tried to stop vaping? What are the characteristics of young people who have attempted to quit? Are these attempts more frequent among young people who believe that e-cigarettes may pose health risks?
Little is known about the difficulties young people face when trying to quit vaping. To what extent do addiction, fear of not being able to quit, fear of not knowing how, the feeling of not being able to control their mood, fear of gaining weight, or feeling insufficiently encouraged by those around them act as barriers when trying to stop vaping? What proportion of young people who have already tried to quit vaping remain abstinent?
What are the objectives and methods?
This study examines vaping cessation among high school students who have previously used e-cigarettes. Its first objective is to identify the proportion of young people who have tried to quit vaping and the factors associated with these attempts. Secondly, it addresses the barriers encountered by young people who have tried to quit e-cigarettes. Thirdly, it explores the association between recent e-cigarette use and barriers encountered during previous cessation attempts.
The study population consists of respondents from the 2023 survey cycle of the COMPASS-Québec school cohort project. The sample comprises 17,194 students who were introduced to e-cigarettes in 98 schools across the health regions of Capitale-Nationale, Chaudière-Appalaches, Gaspésie, Côte-Nord, Bas-Saint-Laurent, and Saguenay-Lac-Saint-Jean. These students are invited annually to complete an online questionnaire about their health and lifestyle habits.
A first set of analyses focuses on factors associated with attempting to quit vaping. Risk ratios are derived after statistical adjustment for each group defined by respondents' age, sex, anxiety level, perceived risks associated with vaping, smoking status, and frequency of vaping in the past 12 months. Interaction terms were included to determine the extent to which these associations might differ depending on the frequency of vaping. Subsequent analyses focus on barriers encountered during attempts to quit vaping.<sup> 8,9 </sup> Respondents were asked to indicate the extent to which each of the following situations constituted a barrier (small, medium, large, or none at all) to quitting vaping: addiction, fear of failure, not knowing how to quit, lack of encouragement from family, lack of encouragement
from friends, weight gain, and feeling less in control of their mood. An additive score reflecting the extent of the barriers encountered is then derived and correlated with recent e-cigarette use. In accordance with standard practice, a young person who has not vaped in the last 30 days is considered abstinent.<sup>10</sup> All analyses are performed using STATA software.<sup>17</sup>
Results
They tried to quit vaping
Forty-five percent of young people who have started using e-cigarettes have already tried to quit vaping. This proportion is almost twice as high among those who vape at least once a month as among occasional users and non-users (Table 1). It is slightly higher among young people from more disadvantaged backgrounds (aRR=1.06, 95% CI (1.01-1.13)) and those with moderate to severe anxiety (aRR=1.07, 95% CI (1.01-1.13)). Neither gender, nor smoking cigarettes, nor having friends who vape appears to be significantly associated with quitting attempts among young people who have started using e-cigarettes.


The proportion of young people who have attempted to quit vaping increases among regular e-cigarette users as the perceived risk of vaping increases (Figure 1). The predicted proportion of regular vapers who have attempted to quit vaping is, after controlling for confounders, 53% (95% CI (45%–61%)) among those who believe that regular e-cigarette use poses no health risks. This proportion is significantly higher among those who, on the contrary, perceive it as posing a significant health risk (adjusted proportion = 66% (95% CI (62%–70%))). The ratio between these proportions is 1.33 (95% CI (1.12–1.54)). Among non-users or
occasional users, however, quit attempts do not appear to be more frequent among those who believe that regular e-cigarette use poses a higher health risk (results not shown).

Barriers encountered by young people who have tried to quit vaping
Figure 2 shows the responses to questions about barriers encountered when attempting to quit e-cigarettes. Addiction was the most frequently mentioned barrier (45%), followed by a feeling of reduced mood control (37%), fear of not being able to quit (30%), and not knowing how (29%). Weight gain was a difficulty for only 16% of respondents. One in six young people (17%) reported encountering no barriers to quitting.

Table 2 presents the responses of young people according to their level of anxiety and their sex. Proportions and risk ratios are adjusted for age and other confounding factors. Regardless of the question asked, more anxious young people reported encountering more barriers when attempting to quit; the excess risk varied between 40% and 75% depending on the question. Girls encountered more barriers than boys for six of the seven questions. They were almost twice as likely to report that weight gain was a barrier to quitting (RR=1.87, 95% CI (1.62-2.15)). They were more often embarrassed by not knowing how to quit (RR=1.34, 95% CI (1.23-1.46)) and more likely to doubt their self-efficacy (RR=1.39, 95% CI (1.28-1.51)). The responses of young people from more disadvantaged families differ significantly from those of other young people for three of the seven questions: "weight gain" (RRa=1.35 CI95(1.20-1.51)) and lack of encouragement from friends (RRa=1.14 CI95(1.04-1.24)) or family (RRa=1.34 CI95(1.19-1.50)).

Barriers to cessation and abstinence
Thirty-six percent of young people who have already tried to quit e-cigarettes report not having vaped in the last 30 days (referred to as abstainers hereafter). The proportion of abstainers decreases as the barriers increase (Figure 3). Sixty-one percent of young people who were not exposed to any of the seven barriers are abstainers. This figure drops to only 37% among respondents who encountered a "minor barrier" during their attempt to quit (score = 1). Only 10% of young people whose score exceeds the median (score greater than 9) are abstainers.

What can we conclude?
The study shows that nearly half of young people who had started vaping had already tried to quit using e-cigarettes. It also reveals that the propensity to try to quit e-cigarettes is more pronounced among regular users, and that it increases among them when they believe that e-cigarettes pose health risks. Vaping is a recent phenomenon; these results can hardly be compared with previous empirical studies. However, they support actions aimed at raising awareness among young people about the dangers of vaping and interventions designed to promote quitting. The implementation of interventions in schools to encourage quitting vaping is considered promising by several authors.<sup> 5,11,12 </sup> The law adopted on October 31, 2023, by the National Assembly of Quebec, which aims to regulate the sale of vaping products, is in line with this perspective.
L’étude révèle que près des deux tiers des jeunes ayant tenté de cesser vapotent toujours. La proportion d’abstinents varie sensiblement selon les barrières rencontrées lors des tentatives de cessation de la cigarette électronique. La levée des principales barrières rencontrées constitue sans doute un facteur clé dans la réussite des interventions visant à promouvoir la cessation de la cigarette électronique. La dépendance est une cible prioritaire pouvant être appréhendée par des politiques ou des règlementations destinées à limiter la concentration en nicotine des produits de vapotage ou le volume des réservoirs et des recharges des produits de vapotage. La gestion des émotions (pouvoir
contrôler son humeur), les connaissances (savoir comment faire pour arrêter), le sentiment d’efficacité (savoir si on peut y arriver) et, chez les filles, les enjeux en lien avec l’image corporelle (peur de prendre du poids), constitue d’autres aspects critiques11,13,14 et des points d’entrée prioritaires dans la formulation d’interventions destinées à promouvoir la cessation du vapotage des jeunes15,16. Des expériences récentes telles que le projet « This is quitting » qui offre du soutien par messages textes aux jeunes pour les encourager, renforcer leur estime de soi et leur fournir des stratégies personnelles pour faire face aux difficultés rencontrées lorsqu’ils veulent arrêter pourraient constituer
des sources d’inspiration potentielles17.
Ces barrières ne sont pas ressenties de la même manière selon que le degré d’anxiété, le sexe et le niveau de défavorisation familial. Ces résultats devront être confirmés et affinés par d’autres travaux. Ils militent a priori pour un ajustement des interventions de promotion de la cessation du vapotage selon les clientèles concernées et les caractéristiques singulières des milieux dans lesquelles elles sont déployées.
Les auteurs espèrent que ces premiers éléments factuels pourront contribuer à soutenir les politiques publiques destinées à réduire l’usage de la cigarette électronique par les jeunes et soutenir des initiatives telles que le projet « Génération sans fumée » et le projet Vaccompagnateur18.
Citation suggérée
Bouchard R, Turcotte-Tremblay AM, Bélanger RE, Bacque-Dion C, Haddad S. La cessation de la cigarette électronique chez les adolescents. Tentatives d’arrêt et barrières rencontrées. Une analyse des cohortes scolaires COMPASSQuébec (2022-2023). Centre de Recherche VITAM. Québec, février 2024.
Financement
COMPASS-Québec bénéficie d’octrois de recherche et du soutien du Ministère de la Santé et des Services Sociaux, du Gouvernement du Québec, des Instituts de Recherche en santé du Canada, et de la Direction régionale de santé publique de la Capitale-Nationale.
Bibliographie
- Lin, C., Gaiha, S.M., & Halpern-Felsher, B. (2022). Nicotine Dependence from Different E-Cigarette Devices and Combustible Cigarettes among US Adolescent and Young Adult Users. International journal of environmental research and public health, 19(10), 5846. https://doi.org/10.3390/ijerph19105846
- Statistics Canada. Canadian Tobacco and Nicotine Survey, 2019. Accessed August 14, 2023. https://www150.statcan.gc.ca/n1/daily-quotidien/200305/dq200305a-fra.htm
- National Center for Chronic Disease Prevention and Health Promotion (US) Office on Smoking and Health. (2012). Preventing Tobacco Use Among Youth and Young Adults: A Report of the Surgeon General. Centers for Disease Control and Prevention (US).
- Smith, RF, McDonald, CG, Bergstrom, HC, Ehlinger, DG, & Brielmaier, JM (2015). Adolescent nicotine induces persistent changes in development of neural connectivity. Neuroscience and biobehavioral reviews, 55, 432-443. https://doi. org/10.1016/j.neubiorev.2015.05.019
- Chadi, N., Schroeder, R., Jensen, J.W., & Levy, S. (2019). Association Between Electronic Cigarette Use and Marijuana Use Among Adolescents and Young Adults: A Systematic Review and Metaanalysis. JAMA pediatrics, 173(10), e192574. https://doi.org/10.1001/jamapediatrics.2019.2574
- Quebec National Institute of Public Health. Vaping nicotine and cannabis: Identifying and understanding the health risks. Accessed August 29, 2023. https://www.inspq.qc.ca/substancespsychoactives/cannabis/vapotage
- Hammond, D., Reid, JL, Rynard, VL, O'Connor, RJ, Goniewicz, ML, Piper, ME, & Bansal-Travers, M. (2021). Indicators of dependence and efforts to quit vaping and smoking among youth in Canada, England and the USA. Tobacco Control, tobaccocontrol-2020-056269. https://doi.org/10. 1136/tobaccocontrol-2020-056269
- Zvolensky, MJ, Garey, L., Mayorga, NA, Rogers, AH, Orr, MF, Ditre, JW, & Peraza, N. (2019). Current pain severity and electronic cigarettes: An initial empirical investigation. Journal of Behavioral Medicine, 42(3), 461-468. https://doi.org/10.1007/s10865-018-9995-7
- Mayorga, NA, Rogers, AH, Smit, T., Garey, L., & Zvolensky, MJ (2021). Evaluating the psychometric properties of the e-cigarette barriers to cessation scale. Cognitive Behavior Therapy, 50(6), 492-508. https://doi.org/10.1080/16506073.2021.1901773
- Amin, S., Pokhrel, P., Elwir, T., Mettias, H., & Kawamoto, CT (2023). A systematic review of experimental and longitudinal studies on e-cigarette use cessation. Addictive Behaviors, 146, 107787. https://doi.org/10.1016/j.addbeh.2023.107787
- Bold, K., Kong, G., Cavallo, D., Davis, D., Jackson, A., & Krishnan-Sarin, S. (2022). School-based E-cigarette cessation programs: What do youth want? Addictive Behaviors, 125, 107167. https://doi.org/10.1016/j.addbeh.2021.107167
- Quebec Public Health Institute. Preventing vaping among youth: a review of current knowledge. Accessed August 14, 2023. https://www.inspq.qc.ca/publications/2787
- Kong, G., Bold, K.W., Cavallo, DA, Davis, DR, Jackson, A., & Krishnan-Sarin, S. (2021). Informing the development of adolescent e-cigarette cessation interventions: A qualitative study. Addictive Behaviors, 114, 106720. https://doi.org/10.1016/j. addbeh.2020.106720
- Sanchez, S., Kaufman, P., Pelletier, H., Baskerville, B., Feng, P., O'Connor, S., Schwartz, R., & Chaiton, M. (2021). Is vaping cessation like smoking cessation? A qualitative study exploring the responses of youth and young adults who vape e-cigarettes. Addictive Behaviors, 113, 106687. https://doi.org/10.1016/j. addbeh.2020.106687
- Twyman, L., Bonevski, B., Paul, C., & Bryant, J. (2014). Perceived barriers to smoking cessation in selected vulnerable groups: A systematic review of the qualitative and quantitative literature. BMJ Open, 4(12), e006414. https://doi.org/10.1136/bmjopen-2014-006414
- Patton, GC, Sawyer, SM, Santelli, JS, Ross, DA, Afifi, R., Allen, NB, Arora, M., Azzopardi, P., Baldwin, W., Bonell, C., Kakuma, R., Kennedy, E., Mahon, J., McGovern, T., Mokdad, AH, Patel, V., Petroni, S., Reavley, N., Taiwo, K., … Viner, R. M. (2016). Our future: A Lancet commission on adolescent health and wellbeing. The Lancet, 387(10036), 2423-2478. https://doi.org/10.1016/S0140-6736(16)00579-1
- Graham, AL, Amato, MS, Cha, S., Jacobs, MA, Bottcher, MM, & Papandonatos, GD (2021). Effectiveness of a Vaping Cessation Text Message Program Among Young Adult e-Cigarette Users. JAMA Internal Medicine, 181(7), 923-930. https://doi.org/10.1001/jamainternmed.2021.1793
- Quebec Council on Tobacco and Health. Smoke-Free Generation Plan. Accessed August 3, 2023. https://cqts.qc.ca/projet/plan-generation-sansfumee/
Effects of the ban on flavored vaping products on e-cigarette use among adolescents.
Authors
Slim Haddad, Richard Bélanger, Natalia Poliakova & Rabi-Joel Gansaonré
The results summarized below are presented in detail in: Haddad, S, Bélanger, RE, Poliakova, N, Gansaonré, RJ, & Leatherdale, ST. (2026). Evaluation of Quebec ban of flavoured vaping products on adolescent electronic cigarette use: a 2022–2024 COMPASS longitudinal analysis. Canadian Journal of Public Health. doi.org/10.17269/s41997-026-01199-6
In October 2023, the Quebec government amended the regulations implementing the Act respecting the fight against tobacco use to prohibit the sale and distribution of flavours and aromas other than tobacco and to tighten standards relating to the labelling of containers, the volume of liquid and the appearance of electronic cigarettes, their components and accessories. 1
The intention is to prevent the use of vaping products, reduce e-cigarette use, and encourage its discontinuation. The amendments to the regulations implementing the Act are specifically aimed at protecting young people from the dangers of exposure to tobacco products and reducing the appeal of e-cigarettes.
This research note focuses on the short-term evaluation of the effects of the amendment to the regulations implementing the Tobacco Control Act (hereinafter referred to as "the intervention") on the use of electronic cigarettes by young people.
Methods
The evaluation study utilizes data from the COMPASS longitudinal surveys ( https://uwaterloo.ca/compass-system/about ) conducted with high school students in Quebec and Ontario. The intervention group consists of a cohort of 4,540 Quebec adolescents aged 14-15 in 2022, attending 68 Quebec high schools. The control group consists of a cohort of 1,491 adolescents of a comparable age, attending 39 Ontario schools. The evaluation design includes three annual observation points in each province. Two observation points are conducted before the intervention's implementation in Quebec (2022 and 2023 survey rounds). The final round is conducted approximately six months after its implementation (2024 survey round).
The assessment of the short-term effects of the intervention is based on the following 5 indicators:
- The proportion of young people not using electronic cigarettes (non-users);
- The proportion of young people using electronic cigarettes daily (daily users);
- The proportion of e-cigarette users who did not use it in the previous year (initiated users);
- The proportion of young people who have reduced the frequency with which they use electronic cigarettes since the previous year (reduction in use);
- The proportion of young people who have stopped using electronic cigarettes since the previous year (cessation).
The evaluation is based on a difference-in-differences analysis, adjusted for the age and sex of respondents. The first difference aims to estimate, for each province, the change in each indicator between the period before and the period after the intervention in Quebec. The difference in differences then allows us to determine the extent to which these changes differ from one province to another. The null hypothesis (no measurable effect) is rejected if the difference in differences is statistically significant. Examining the changes between the two years preceding the intervention (2022 and 2023 rounds) ensures comparable trends in both provinces before the introduction of the regulatory amendment.
Results
Tables 1 and 2 deal respectively with the proportion of non-users and daily users during the rounds preceding and following the intervention. The difference-in-differences analysis does not allow us to reject the hypothesis of no effect of the intervention on these two indicators.
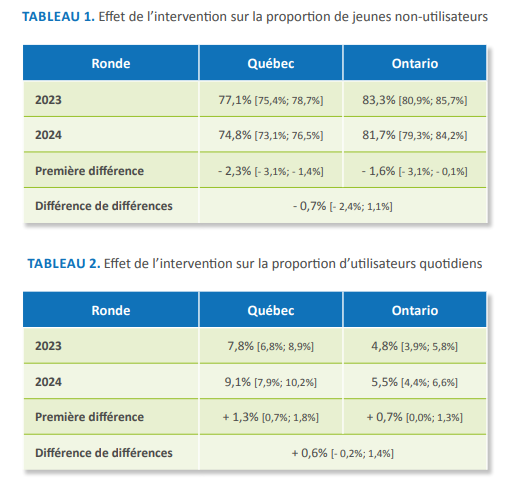
Tables 3 to 5 report the results of the analyses concerning the indicators relating to changes in behavior in the same individual between two observation rounds. As with the first two indicators, the difference-in-differences analysis does not allow us to reject the hypothesis of no effect of the intervention.
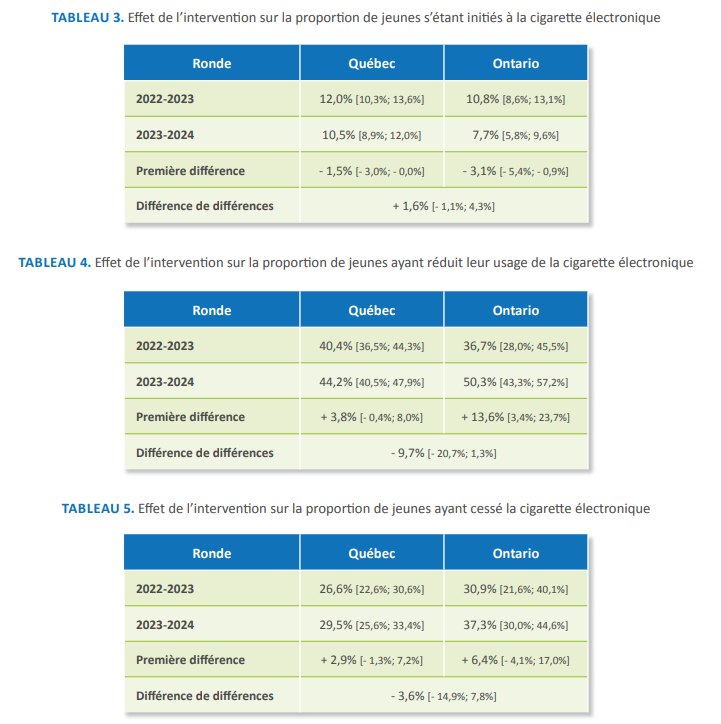
Interpretation
The research did not identify any short-term effect of regulatory changes on e-cigarette use among the young people in the study group. This result is consistent with those reported in other contexts, particularly in the United States, revealing the limited effectiveness of isolated regulatory measures targeting exclusively the sale and distribution of e-cigarettes and their components. 2,3,4
The attention paid to the evaluation method appears to contribute to the credibility of the results. The evaluation is based on a robust quasi-experimental design, comprising a study group and a comparison group not exposed to the intervention. Observations of the two cohorts of adolescents were conducted before and after the changes to Quebec regulations. Two measurement points prior to the intervention helped validate the comparative analysis approach. From a results perspective, the information from all indicators is similar, suggesting no difference in outcomes between the study group and the comparison group. These results are supported by the placebo test, which compared the differences in outcomes between the two groups for e-cigarette use and cigarette use, the latter being unaffected by the change in Quebec regulations.
Implications
The lack of short-term effects from regulatory changes in no way justifies abandoning strategies aimed at regulating access to flavored products. Rather, this work highlights the need to consider regulatory strategies from a broader perspective, taking into account the forces that determine the supply and demand of vaping products in general, and flavored products in particular.
Among the measures that could be considered are:
- Targeting youth access to flavored products would benefit from taking into account the diversity of supply sources and regulatory circumvention strategies that may be deployed by actors involved in the production, distribution and marketing of vaping products.
- The regulations could be supported by better monitoring of their application.
- Targeted educational interventions aimed at both young consumers and retailers could increase the social acceptability of the regulation and promote compliance.
- Research should continue to better understand and track the evolution of the flavored products market, identify the circumvention strategies of market players, evaluate the results of interventions carried out in various contexts to limit the diffusion and use of flavored products and finally, propose and test programs or policies with greater potential for success that would simultaneously target the key determinants of supply and demand for vaping products.
Suggested quote
Haddad, S., Bélanger, RE, Poliakova, N., & Gansaonré, RJ. Effects of the ban on flavored vaping products on e-cigarette use among adolescents. COMPASS-Québec. Research Report/Note No. 6. VITAM Research Centre. Quebec City, May 2026.
References
- Government of Quebec. (2023). Order in Council 1251-2023, July 19, 2023 – Regulation amending the Regulation respecting the application of the Act respecting the fight against smoking. Vol. 155(31), Part 2, p. 3682. https://www.publicationsduquebec.gouv.qc.ca/fileadmin/gazette/pdf_encrypte/lois_reglements/2023F/80439.pdf
- Dove, M.S., Gee, K., & Tong, EK (2023, Jan 1). Flavored Tobacco Sales Restrictions and Teen E-cigarette Use: Quasi-experimental Evidence From California. Nicotine Tob Res, 25(1), 127-134. https://doi.org/10.1093/ntr/ntac200
- Hammond, D., Reid, JL, Burkhalter, R., Bansal Travers, M., Gravely, S., Hyland, A., Kasza, K., & McNeill, A. (2022, Jul). E-Cigarette Flavors, Devices, and Brands Used by Youths Before and After Partial Flavor Restrictions in the United States: Canada, England, and the United States, 2017‒2020. Am J Public Health, 112(7), 1014-1024. https://doi. org/10.2105/AJPH.2022.306780
- Hawkins, S.S., Coley, R.L., Lanteri, L., & Baum, C.F. (2025, Mar 12). How adolescent tobacco use has responded to state tobacco 21 laws and flavor restrictions. Am J Drug Alcohol Abuse, 1-12. https://doi.org/10.1080/00952990.2024.2444567
Going to bed late, getting up early, and not getting enough sleep. Analysis of young people's sleep needs in the COMPASS-Québec 2025 survey.
Link to the report:
Authors
Slim Haddad, MD, PhD; Richard E. Bélanger, MD; Natalia Poliakova, PhD; Benjamin Tézier, PhD; and Anne-Marie Turcotte-Tremblay, PhD
Summary
This study examines the sleep needs of 71,000 secondary school students who participated in the ninth round (2024-2025) of the COMPASS project in Quebec. Sleep is addressed from the perspective of understanding the intensity of these students' needs, rather than solely from the standpoint of normative recommendations.
Distinguishing between varying sleep intensity needs and considering bedtime and wake-up time highlights vulnerabilities specific to certain social groups. Sleep deprivation, and especially severe sleep deprivation, is associated with poorer physical health and adverse mental health indicators. Academic performance and engagement with school are better among young people who get enough sleep.
The use of screens for recreational purposes and a heavy workload of paid work contribute to later bedtimes and are associated with more severe sleep deprivation. Beyond behavioral factors, young people's sleep needs must be interpreted in light of the demands of daily life and the "marathon days" to which many are exposed. The time it takes to get to school and the start time of classes play a major role in the organization of the day and significantly constrain the time at which young people must get up. Our simulations suggest that shifting the start time of classes would reduce the sleep deficit of young people who have to get up early to go to school.
More evidence is still needed to identify the key ingredients for successful interventions aimed at reducing sleep deficits among young people. The study's findings suggest prioritizing actions that promote sleep-friendly routines, prevent young people from waking up too early, and protect them from excessive paid workloads. The school environment appears to be a particularly relevant lever for promoting sleep, as it allows access to a large pool of young people at a crucial stage in the development of sleep-wake rhythm behaviors.
Problematic
Several studies suggest that young people's sleep time tends to decrease and that their sleep quality is declining. <sup>1-4</sup> The proportion of young people in Quebec who usually meet the recommended number of hours of sleep per week reportedly fell from 63% in 2016-2017 to 50% in 2022-2023.<sup> 5</sup>
Sleep deprivation is a public health issue due to its impact on the health and functioning of young people.<sup> 1</sup> Young people who do not get enough sleep experience more anxiety and depressive symptoms and are at greater risk of experiencing difficulties with emotional regulation.<sup> 1-3,6-8</sup> Sleep deprivation has been linked to a weakened immune system, an increased risk of chronic diseases, and a reduced life expectancy.<sup> 1,6,8,9</sup> Insufficient sleep is associated with decreased cognitive performance, difficulty concentrating, and lower academic achievement.<sup> 1-3,6-8</sup>
Sleep deprivation is linked to various socio-demographic and behavioral characteristics. In Quebec, girls, young people living in disadvantaged, blended, or two-parent families, and those whose parents are less educated are less likely to meet the recommended number of hours of sleep during the school week.<sup> 10 </sup> They are also less active and more exposed to screens. The 2025 COMPASS survey reveals that an increase in time spent on recreational screen activities is associated with increasingly later bedtimes, particularly when these activities involve social media, video games, and text messaging.<sup> 11</sup> In 2022, teenagers spent almost as much time sleeping as using recreational screens.<sup> 12</sup> Sleep onset is delayed and sleep quality is disrupted by the engaging or stimulating nature of certain digital activities.<sup> 13</sup> Exposure to the blue light emitted by screens decreases melatonin secretion and disrupts the circadian rhythm. 14 Screen addiction ultimately contributes to sleep deprivation among teenagers. 9
Research on young people's sleep has helped to identify a range of issues related to their health, lifestyle habits, and family environment. However, this knowledge remains relatively fragmented, and several areas of research are still unexplored. A review of the scientific literature, along with a consultation of international experts, recently suggested that a better understanding of the effects of sleep deprivation on adolescents' mental health should be prioritized for further research. 15
The study of sleep determinants tends to focus heavily on the behavioral or socio-demographic origins of sleep deprivation. It devotes less attention to understanding the role that the school environment and structural factors can play in the duration and quality of sleep. Adolescent sleep cannot be considered solely the product of lifestyle habits or the characteristics of the family environment.<sup> 16</sup> It is largely shaped by daily activities and the constraints imposed by school attendance, the time spent on paid work, or commuting between home, school, extracurricular activities, and any potential workplace. The start time of classes, the distances to travel to and from school, the organization of school trips, and the workload of homework are all structural constraints over which young people have little or no real control. These constraints are likely to have a significant impact on wake-up time, bedtime, and therefore the duration and quality of the young person's sleep.
The study of sleep needs thus benefits from a dual perspective, highlighting the impact of lifestyle habits and daily constraints on young people's sleep and helping to understand how the needs encountered in different school settings are shaped by the context or composition of their student body. School is central to the daily lives of adolescents and constitutes a privileged environment for promoting well-being and the adoption of healthy lifestyle habits. 17
Several studies on the determinants of sleep deprivation focus on adherence to the recommended number of hours of sleep, comparing young people who get enough sleep with those who don't. The authors argue that this approach is simplistic, providing only a limited picture of sleep needs. Some young people who don't meet these recommendations are only slightly sleep-deprived, while others are severely so. These inequalities in needs are masked by a metric that is too simplistic to differentiate the degrees of vulnerability encountered and understand the sources of these vulnerabilities. A more nuanced understanding of sleep deficit that goes beyond simply determining the presence or absence of sleep deprivation is essential to grasp the extent and severity of needs, identify potential vulnerable groups, and inform interventions to support young people whose needs are most acute.
This study is based on survey data from the COMPASS school cohorts. The first step is to describe the incidence and severity of sleep deficits and to provide an overview of the health challenges and academic difficulties experienced by young people with sleep deprivation. The examination then focuses on the association between sleep deprivation and recreational screen use, time spent in paid activities, and time spent commuting to school in the morning.
The second stage focuses on the expression of sleep needs observed at the school level. It examines the disparities in sleep needs among the 136 participating schools and then explores the ability to explain some of these differences through variations in class start time, school location, or student population composition. A final section provides a brief overview of the schools where the needs are most acute.
Methods
Estimates, population, measurements
The study is based on annual data from the ninth round (2024-2025) of the COMPASS school cohorts in the province of Quebec. The study population consists of 71,833 respondents who provided answers to the key questions in the questionnaire concerning demographic characteristics and the program of study followed (inclusion criteria). The exclusion criteria are: (1) attending one of the ten schools offering specialized educational pathways for students with special needs; and (2) completing the questionnaire within seven days of the March break (March 3-7, 2025) to avoid introducing bias into responses regarding bedtimes and wake-up times from the previous week.
The analysis of sleep needs and challenges faced by sleep-deprived young people was conducted on the entire sample of study participants (N=71,833). The unit of analysis was therefore the young respondent. For the section concerning the expression of needs observed at the ecological scale, the unit of analysis was the school.
The population includes 136 secondary schools. Four schools with insufficient enrollment to provide stable statistical estimates were removed. Tables S1a and S1b, provided in the appendix, report on these two study populations.
Annual surveys in secondary schools participating in the COMPASS project provide a wide range of information on the health, perceptions, and lifestyles of adolescents. All students in participating schools are eligible for the survey. The median participation rate per school was 90% for the 2024-2025 round. Data collection was conducted online using Qualtrics XM (Qualtrics, Provo, UT, USA). The parental refusal rate was 0.5% (N=385). Further information on the methods and protocols of the COMPASS study is available online ( https://uwaterloo.ca/compass-system/ ).
Sleep measurement is based primarily on responses to four questions about bedtime and wake-up time on weekdays and weekends. The wording of the questions is based on those used in the Health Behaviour in School-Aged Youth Survey (HBSC), a widely used instrument among researchers in the field. The measurements are provided by the youth in hours and quarter-hours. These measurements serve as the basis for calculating the number of hours of sleep and sleep requirement, defined later. The predictors of sleep requirement considered in the study are: age, sex (demographic characteristics), recreational screen time, hours worked (behavioral determinants), family disadvantage, usual commute time to school, type of school attended (public or private), school start time, and school location (structural determinants). Each school is located in one of five zones defined by Statistics Canada based on community size (census metropolitan areas and census agglomerations) or metropolitan influence (strong, moderate, weak, or none). Two types of correlates are considered in relation to sleep needs. The first concerns the young person's perceived health (overall physical or mental health), their level of anxiety, their ability to regulate their emotions, and their weight status. The second concerns the young person and their school: their academic performance (recent failure in one of the core subjects such as French, English, or mathematics), their degree of agreement with a statement that they feel safe in their school, and a statement that they feel a strong sense of belonging to their school.
Analyses
The concept of sleep requirement is understood based on the number of hours of sleep recommended for age groups under thirteen (nine to eleven hours), fourteen to seventeen (eight to ten hours), and eighteen and over (seven to nine hours). The measurement of sleep requirement derives, as in other work conducted by our team, from approaches used for health poverty analysis.
Figure 1 illustrates the approach to sleep deprivation. Young people are first classified according to their sleep duration and then divided into 100 equal groups (percentiles). Each point on the blue curve represents the median sleep duration. The red horizontal line corresponds to the minimum recommended sleep duration. The point where the curve intersects this line allows us to estimate, by projection, the proportion of young people whose sleep duration equals the recommended threshold. For each group to the left of this value, the median sleep duration is less than the recommended sleep duration. All these young people therefore have a sleep deprivation. However, the situation of these individuals differs significantly: a person in group B is further from the recommended threshold than a person in group A. The established terminology is to say that the depth of the need for sleep in group B is greater than in group A.
The depth of sleep deprivation can be assessed in various ways. In this study, we distinguish three levels of sleep deprivation: moderate if the sleep deficit is less than one hour below the recommended amount, high if the difference from the recommended threshold is one to two hours, and severe if the difference exceeds two hours. Ultimately, a young person can fall into one of the following five categories depending on whether their sleep duration is above, within, or below the recommended range (three values). This study will focus on young people experiencing sleep deprivation, that is, on the last three categories.
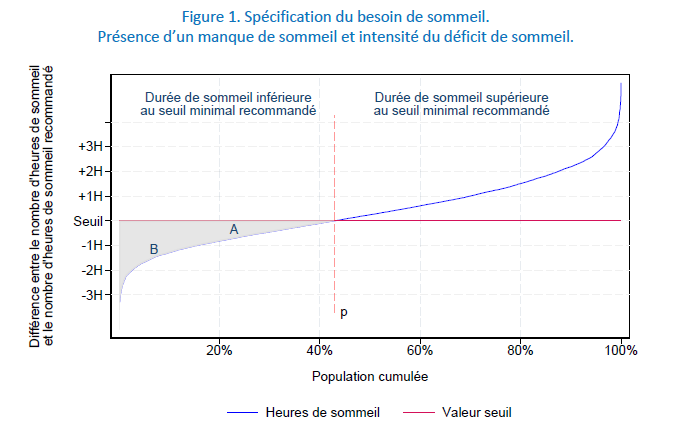
To facilitate comparisons between respondents and between schools, all estimators are adjusted for the respondents' sex and age. The adjustment is based on statistical models adapted to the indicator metrics: robust Poisson regressions for the presence/absence of sleep deficit variable, generalized ordered logistic regressions for the ordered categorical variable (sleep deficit with five categories), and quantile regressions for adjusting median times (sleep, bedtime, and wake-up time). Analyses are performed using Stata software. Standard errors and confidence intervals are calculated using Stata's Delta method from marginal effects (incidence and severity of the deficit) or, for median times, by resampling (bootstrap – 200 iterations).
Results
The first section addresses the respondents' sleep deficits. The second examines the differences in needs observed in the participating schools. Inequalities between respondents and between schools are considered in relation to individual or structural characteristics, as described in the Methods section.
Sleep deficit among respondents
Incidence, intensity and inequality of sleep deficits
One in three young people (33%) sleeps less than the recommended number of hours on school days, and more than one in six (17%) is sleep-deprived by more than one hour per night. Girls are more likely to be sleep-deprived than boys (Figure 2). Younger children are more likely to be sleep-deprived on weekdays, even though the recommended sleep standard for this age group is higher (at least nine hours per night). The proportion of young people with severe sleep deprivation is 5% among boys, 7% among girls, and 10% among those who do not identify as either male or female, or who prefer not to answer. Young people tend to sleep more on weekends. Only one in five (20%) are sleep-deprived on days when there is no school. They are four times more likely to sleep more than the recommended number of hours than they are on school days (22% vs. 5%). The following developments focus on the sleep needs encountered during the week, when young people are at school.
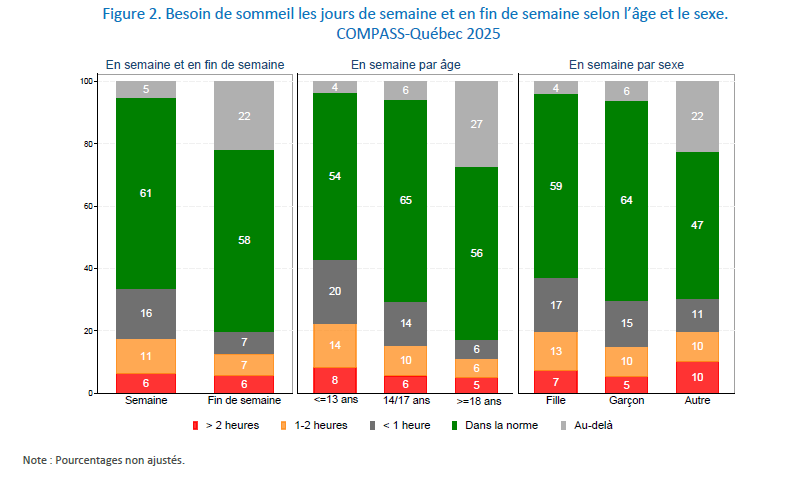
Sleep deprivation and screen time
Figure 3 illustrates the relationship between sleep deprivation and recreational screen use. The values provided are adjusted for the respondents' age, sex, and family socioeconomic status. The need for sleep increases significantly with screen time, regardless of the type of screen. For all screen types, the proportion of young people with severe sleep deprivation doubles among the most frequent screen users compared to those who spend less than one hour per day on screens. This proportion triples among young people who spend more than three hours texting.
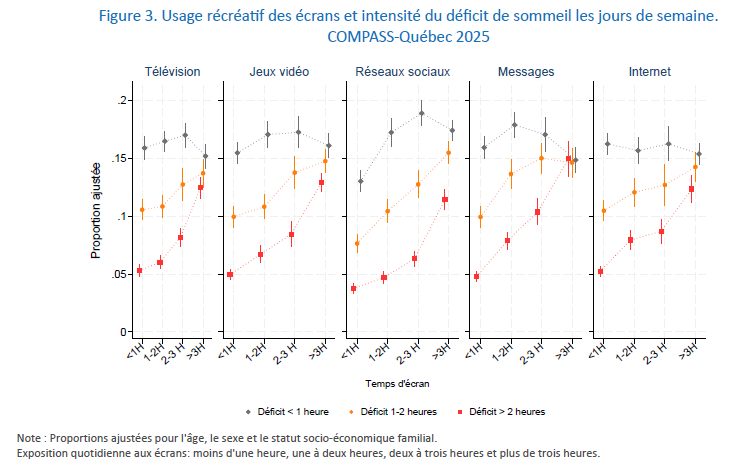
Figure 4 shows that sleep deprivation linked to screen use is attributable to a shift in bedtime. While school schedules require them to continue getting up at the same time,
heavy screen users go to bed substantially later. More than half of young people who spend at least three hours a day on a given type of screen go to bed after 10:30 p.m.
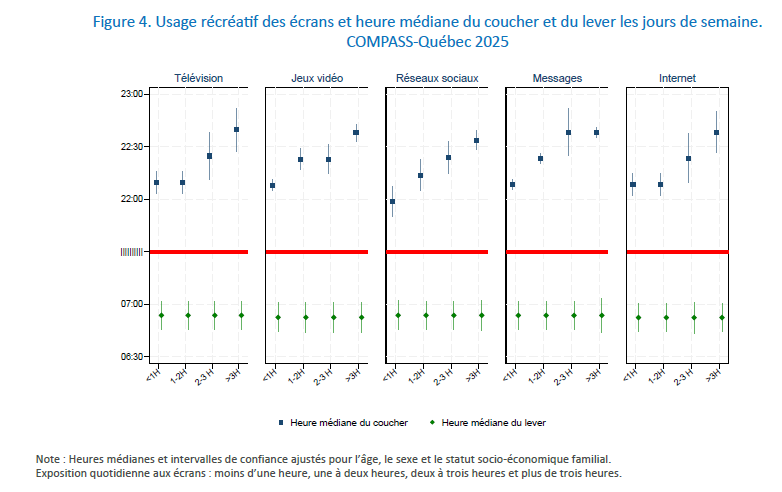
Health challenges for young people who lack sleep
Table 1 reveals a strong association between sleep deprivation and health indicators. Young people with poorer overall physical health are overrepresented among those who are sleep deprived (aRR = 1.33; 95% CI [1.28; 1.37]), as are those who are overweight. The association is even more pronounced with regard to mental health. Sleep-deprived young people have a more negative assessment of their mental health (aRR = 1.52; 95% CI [1.47; 1.58]); they more frequently exhibit symptoms of moderate to severe anxiety (aRR = 1.48; 95% CI [1.42; 1.54]) and show lower emotional regulation skills (aRR = 1.40; 95% CI [1.34; 1.45]).
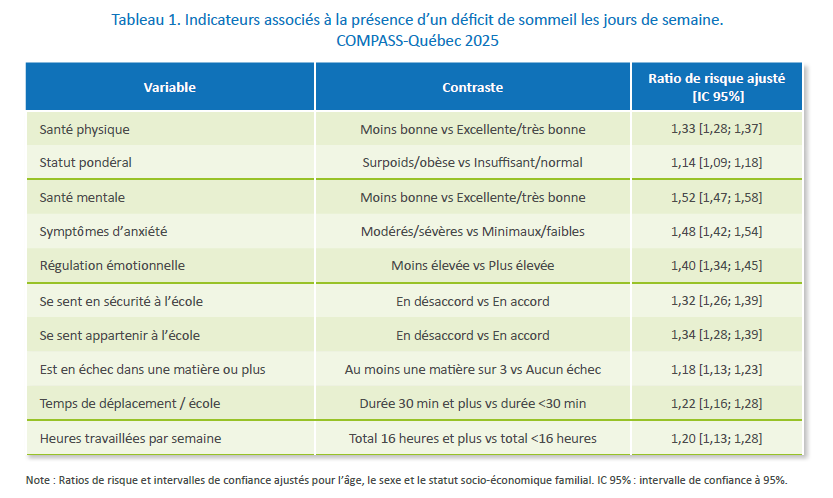
Figure 5 allows us to refine our examination of the relationship between health status measures and the severity of sleep deficit. The proportion of young people with a sleep deficit of more than two hours is consistently higher among those with unfavorable health indicators, regardless of the health status measure considered (physical or mental health, emotional regulation, anxiety symptoms). Young people with less favorable health indicators are also overrepresented among those with a sleep deficit of one to two hours. They are also overrepresented, albeit to a lesser extent, among those with a moderate sleep deficit (less than one hour).
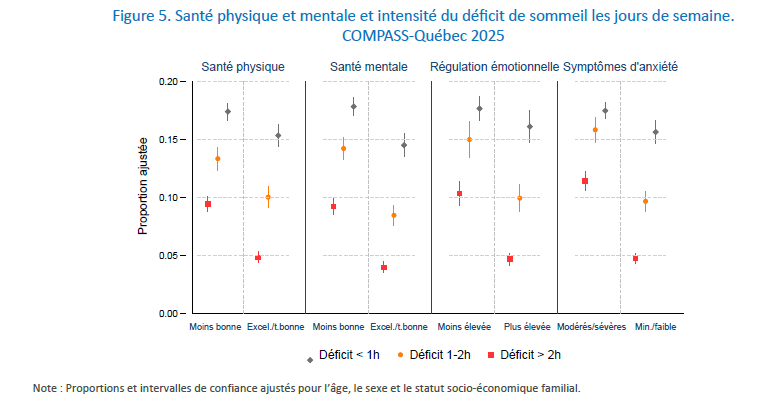
A young person with severe sleep deprivation is twice as likely to report poorer physical health (RR = 1.95; 95% CI [1.82; 2.07]) and nearly two and a half times more likely to report poorer mental health (Table 2). The risk ratios are less pronounced but still statistically significant when the sleep deficit is only one to two hours or less than one hour.
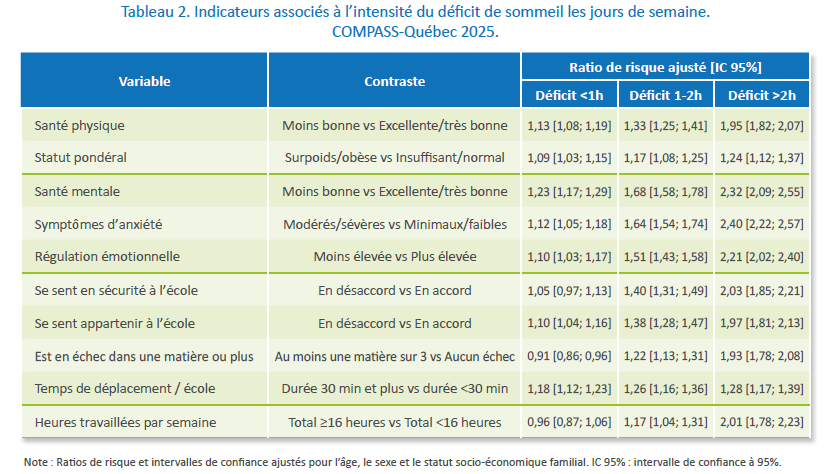
School challenges for young people who lack sleep
The picture is very similar to that observed for health indicators. At the same age and sex, young people with a stronger relationship with their school and those with better academic performance are less likely to experience sleep deprivation (Table 1). Here again, examining the risk ratios for each level of sleep deficit reveals a weak link between academic difficulties and sleep needs (Figure 6, Table 2). The gap between high-achieving young people and those who are failing or less engaged with their school is greatest when the deficit exceeds two hours per night. The association is comparable when considering proximity to school.
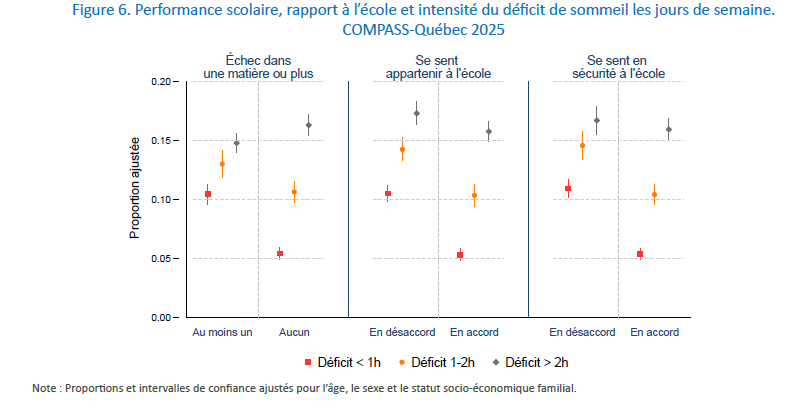
Sleep deprivation is more common among young people who spend more time commuting to school (Table 1). A commute of more than 30 minutes is associated with a 22% increased risk of sleep deprivation (aRR = 1.22; 95% CI [1.16; 1.28]) and a 28% increased risk of severe sleep deprivation (aRR = 2.01; 95% CI [1.78; 2.23]). Young people with longer commutes get up earlier than others. They also go to bed earlier, but this is not enough to compensate for the hours of sleep lost due to getting up earlier (Figure 7).
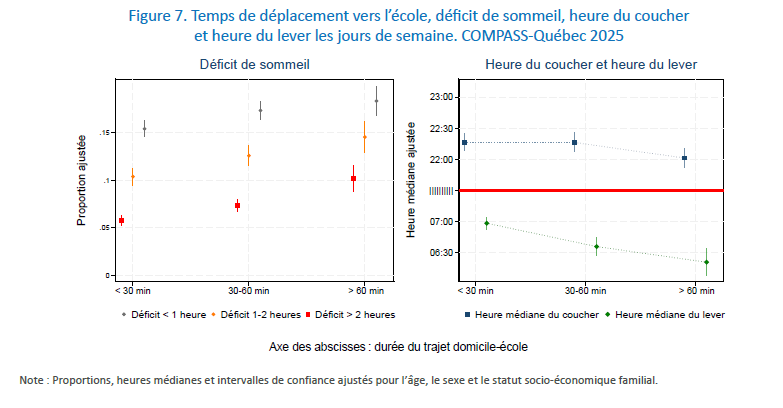
The workload of paid work and lack of sleep
Figure 8 illustrates the relationship between the number of hours worked and sleep deficit. Generally, there is no increase in sleep deficit as long as one works ten hours or less per week. Beyond this point, sleep needs become more acute, and a breakdown occurs when the paid workload reaches sixteen hours. The risk of severe sleep deficit doubles if working time exceeds this threshold (RRa = 2.01; 95% CI [1.78; 2.23]). Wake-up time is insensitive to the number of hours worked. The same is true for bedtime, except among young people working more than twenty hours per week.
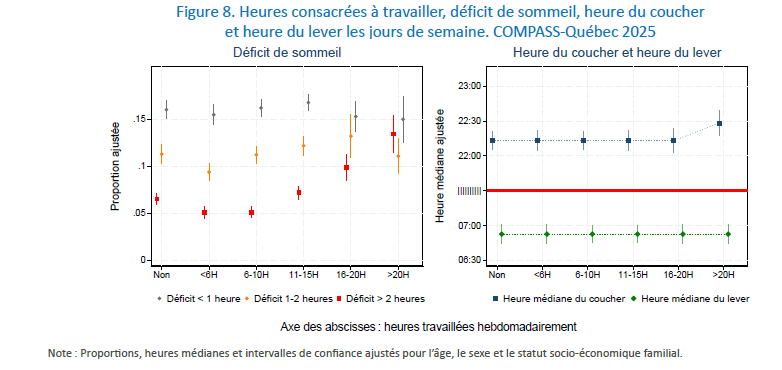
Challenges faced by schools
Unequal needs between schools
The sleep needs of young people vary substantially from school to school, with the median sleep duration ranging from 1.3 hours. On weekdays, the median sleep duration is eight hours in the school with the lowest sleep duration and over nine hours in the school with the highest (Table 3). Depending on the school, the median bedtime is between 9:30 p.m. and 10:45 p.m., and the median wake-up time is between 6:15 a.m. and 7:15 a.m. (Figure 9). Bedtime varies more than wake-up time.
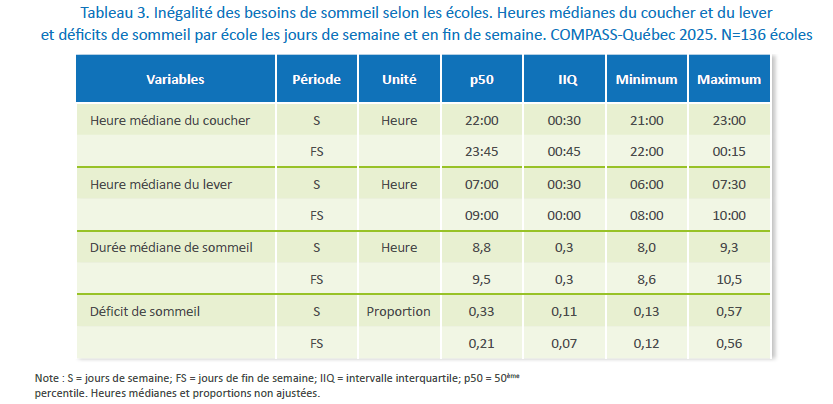
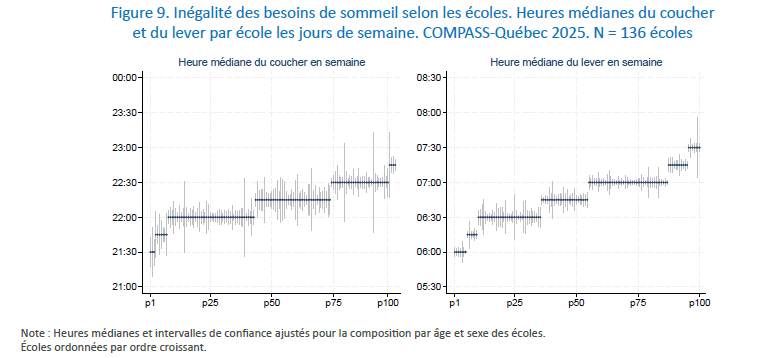
The proportion of sleep-deprived youth on weekdays varies by school from 0.13 to 0.57 (median = 0.33; interquantile range [IQR] = 0.11; Gini coefficient = 0.13; 95% CI [0.12, 0.15]). These differences persist after medians and proportions are adjusted for school demographics (median = 0.32; IQR = 0.11; Figure 10). After adjustment, the proportion of sleep-deprived youth on weekdays ranges from one in ten in schools with the lowest sleep needs to more than one in five in those with the highest sleep deficit. The proportion of youth with moderate sleep deficit exceeds 0.15 in half of the schools (Figure 11). One in fifteen young people has a severe sleep deficit in one out of two schools (adjusted median = 0.06; range of 0.14; IQR = 0.04).
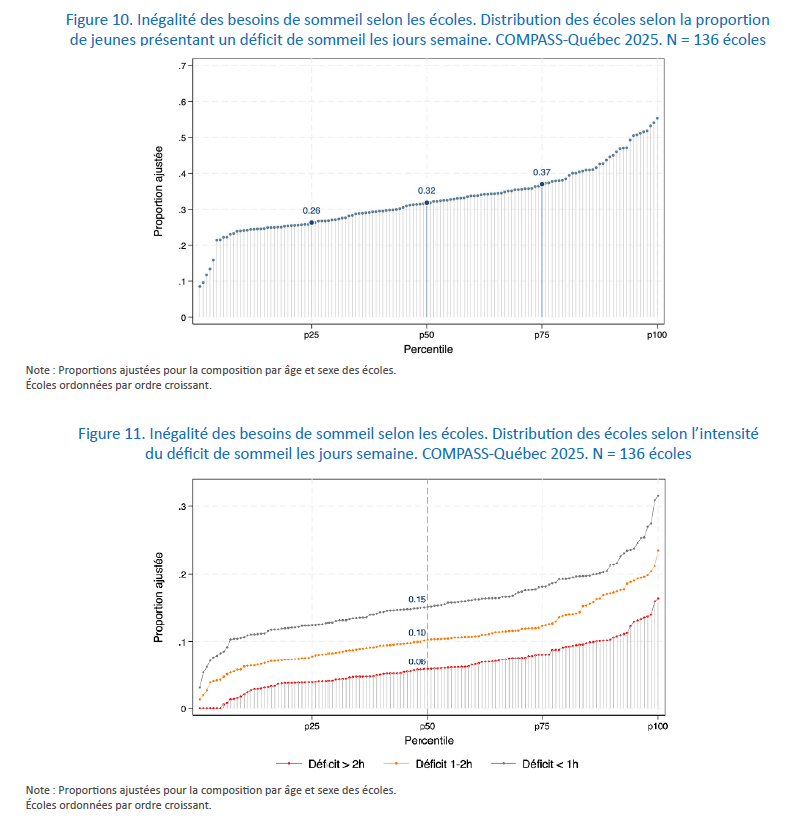
Severe sleep deprivation is more than one and a half times the median in 29 of the 136 schools (21.3%). Students in these schools experience more frequent sleep deprivation, whether it be overall, moderate, severe, or significant.
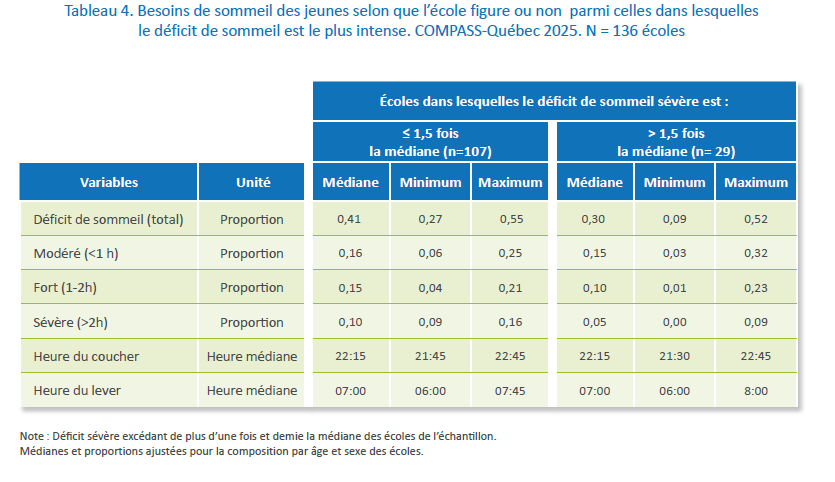
Sleep deficit and class start time
For most students, school starts between 8:00 and 9:30 a.m., with the median time being 8:50 a.m. (Figure 12). Regardless of any other considerations related to the school environment, the earlier classes start, the higher the proportion of sleep-deprived students. As expected, the association disappears when considering sleep patterns on weekends.
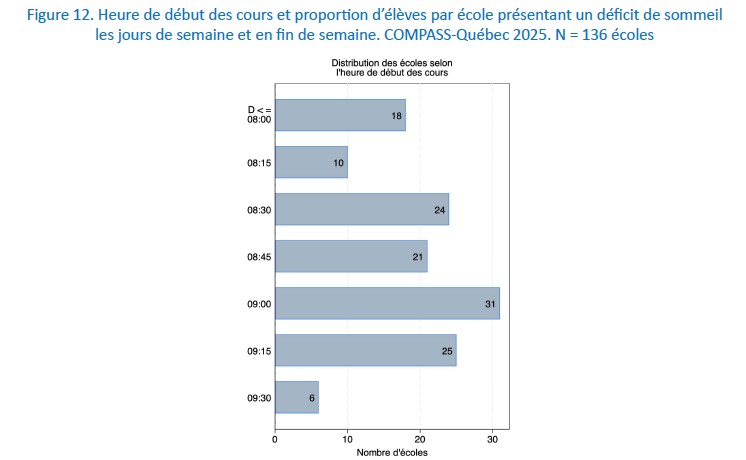
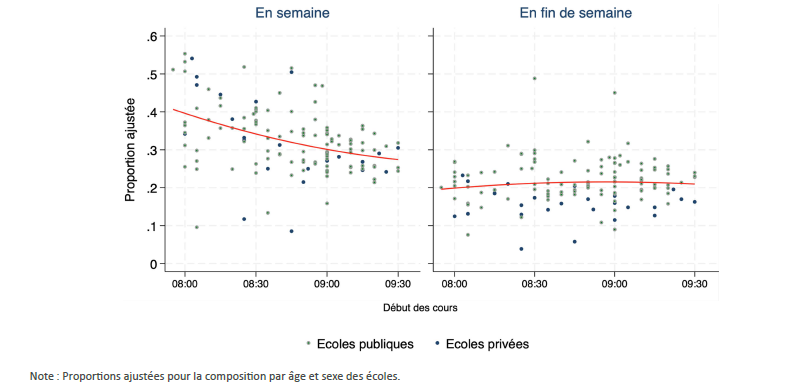
Young people in schools where classes start earlier get up earlier (Figure 13). They also go to bed earlier, but as the regression slopes show, the earlier bedtime does not compensate for an earlier wake-up.
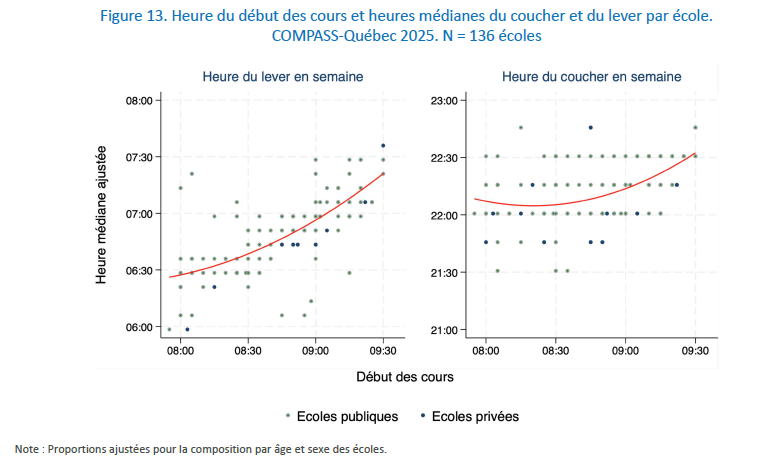
Table 5 presents the results of a simulation conducted to estimate the potential benefits of delaying the start of classes. The estimation focuses on the incidence and severity of sleep deficits under different class start time scenarios, taking into account the school's demographic composition and the distribution of commute times for the students who attend. The proportion of sleep-deprived students is estimated under five class start time scenarios (8:00, 8:15, 8:30, 8:45, and 9:00). The benefit associated with a fifteen-minute delay in the start of classes is then calculated in each scenario. Finally, the average benefit associated with a fifteen-minute or half-hour delay in the start of classes is estimated. This allows for a comparison of the anticipated effects of delaying the start of classes according to the severity of sleep deprivation.
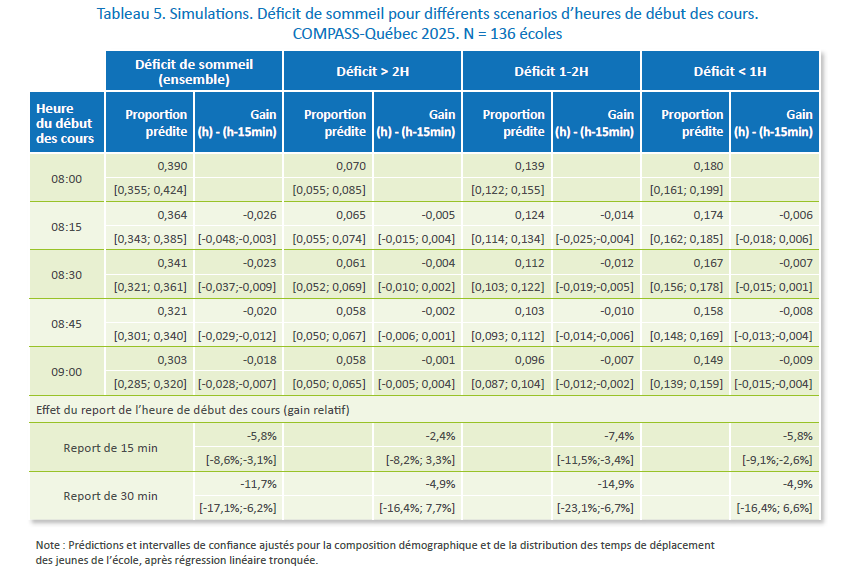
The results presented in Table 5 are indicative only and should be interpreted with caution due to the limited sample size and possible residual confounding. The simulations suggest that even a slight delay of fifteen minutes in the start time of classes could contribute to a significant reduction in the proportion of sleep-deprived young people. Those young people with significant sleep deprivation would likely benefit most from these measures.
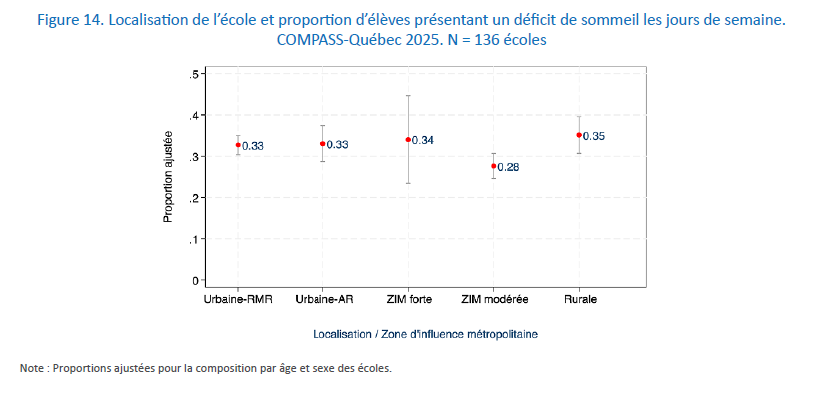
Sleep deficit and school location
Relating the proportion of young people lacking sleep in the 2025 survey to the location of the school does not allow us to identify a clear trend (figure 14).
Sleep deficit and the composition of the school's clientele
Figure 15 illustrates the relationship between the composition of the student population and the proportion of young people experiencing sleep deprivation. Schools with higher rates of sleep deprivation have students who tend to be more anxious (correlation coefficient r = 0.39) and feel less safe at school (r = -0.30). There is also a higher concentration of recent immigrants (r = 0.24) and young people from disadvantaged families (r = 0.20) in areas where needs are greater, but the association is less pronounced.
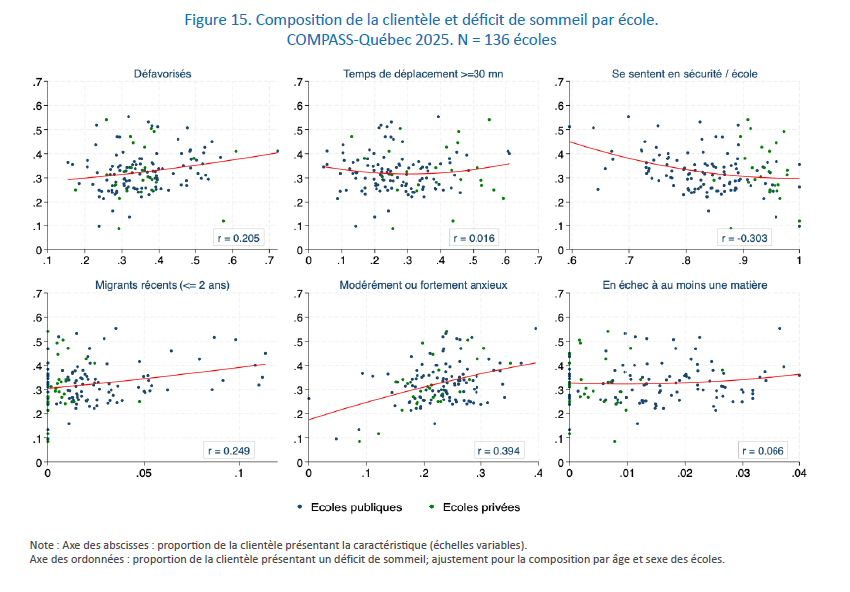
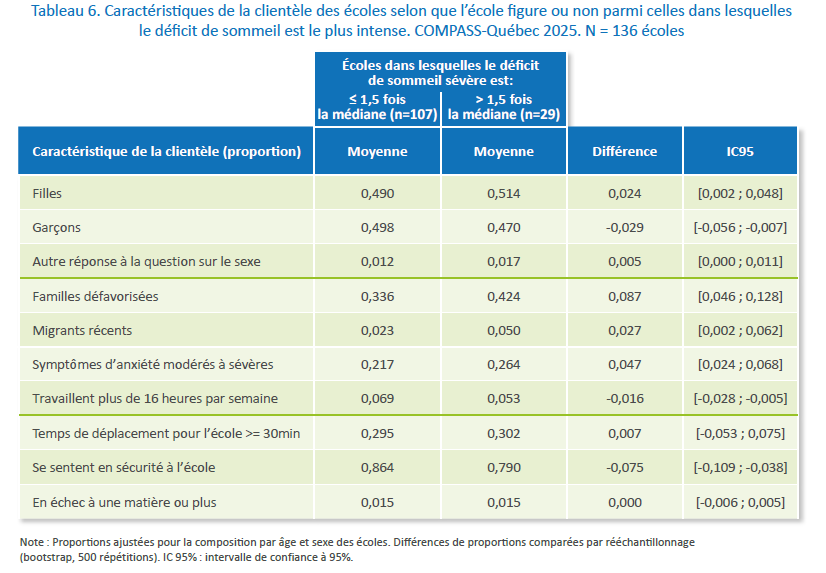
A look at the schools where sleep deprivation is most severe
Table 6 compares the student population composition of schools where the proportion of students with severe sleep deprivation exceeds one and a half times the median of the study population with that of other schools. The comparison focuses on the average proportion of students with various individual or family characteristics. The differences are bootstrapped to derive the confidence intervals.
Schools with the most severe sleep deprivation stand out due to their student body composition. They have a higher proportion of girls, students from disadvantaged families, and recent immigrants. Students in these schools report moderate to severe anxiety symptoms more frequently but are less likely to work more than sixteen hours per week and to feel safe at school.
Discussion
Promote sleep-friendly routines
Strengthening healthy sleep routines in young people can take various forms: maintaining a regular sleep schedule, limiting screen time in the bedroom or in the hour before bedtime, avoiding late-night meals or drinks, creating a calm environment, getting sunlight during the day and dimming the lights after sunset, or prioritizing relaxation activities that promote sleep preparation. Structured behavioral approaches offer a relevant framework for encouraging the gradual reduction of stimulating activities before bedtime, such as caffeine or alcohol consumption, late meals, work , or screen time. Sleep is also improved by regular physical activity during the day.
Strengthening healthy sleep routines is all the more beneficial because it would make it possible to reduce the use of compensatory sleep aids, such as cannabis and melatonin. Cannabis is indeed frequently used by teenagers to promote sleep or alleviate sleep difficulties.<sup> 25</sup> An American study reports that nearly one in five children (19%) take a melatonin supplement to help them sleep.<sup> 26</sup>
Many digital platforms incorporate persuasive design mechanisms and, in some cases, deceptive interfaces ( dark patterns ) <sup>27 </sup> aimed at directing users toward actions that run counter to their interests (e.g., frequently returning to the application, prolonging usage time with features like infinite scrolling, making impulsive purchases, accepting notifications, or sharing personal information). These strategies can contribute to increased screen time in the evening and encroach on sleep. In this context, there is a growing need for better regulation of young people's exposure to digital platforms, particularly at the earliest ages, and for support in developing digital environments that are more compatible with young people's sleep.<sup> 28,29</sup> Some countries have decided to establish a minimum age for creating accounts on online platforms. These regulations apply in particular to social networks, video games, video streaming platforms, and AI-powered chatbots. By targeting potentially harmful features such as autoplay and engagement-based algorithms, the goal is to protect young people while preserving their ability to access information.
Prevent young people from getting up too early
The study's results corroborate those of previous work showing that longer travel time to school is associated with earlier wake-up times.<sup> 30-32 </sup> Beyond its effect on sleep itself, prolonged travel time impacts young people's daily rhythms. By lengthening the school day, it contributes to "marathon days" and reduces the time available for extracurricular activities, both at school and outside of school.<sup> 33</sup> Furthermore, time spent sitting during transportation (by car, bus, or subway) contributes to sedentary behavior. Ultimately, these constraints can impair young people's attention span and academic performance.<sup> 33</sup> Reducing travel time is a necessity that seems relatively easy to agree upon. However, it is also a challenge related to the provision of education, the management of school schedules and transportation, parental preferences, urban planning and transportation infrastructure, and so on.
The impact of school start time on sleep deprivation and daily rhythms follows the same logic. Here too, the study supports previous research. 34 Although limited in scope, our simulations suggest that even a modest delay in the start of classes could help reduce the proportion of sleep-deprived young people. The results suggest that young people with a greater sleep deficit would benefit more. Experiments conducted in real-world settings show that delaying the start of classes allows young people to get up later without causing a comparable shift in bedtime, thus resulting in a net gain in sleep. 35-37 The American Academy of Pediatrics recommends that secondary schools start no earlier than 8:30 a.m. (in our sample, classes begin before 8:30 a.m. in nearly a third of the schools, or 36 out of 136).
Protecting young people from excessive paid workload
Early involvement in the world of work has long been associated with superior intellectual development in young people and greater professional, social, and civic skills. <sup>39</sup> A recent OECD review suggests that gaining work experience during studies promotes better access to the labor market in adulthood and higher future earnings. <sup>40 </sup> Fewer school dropouts and better academic performance have also been reported among working young people. But the detrimental effects of strenuous, intense, or stressful work on the circadian rhythm, and beyond, on physical and mental health, quality of life, and academic attrition, are also widely documented. Long working hours compete with other daily activities and reduce time for leisure, homework, rest, and, of course, sleep. Young people also tend to be more exposed to occupational hazards, given that lack of sleep, in turn, increases the risk of workplace accidents.<sup> 41 </sup> It all comes down to finding the right balance; The impact of work on health and well-being is primarily linked to the context in which the activity takes place.
Our work focused solely on the temporal dimension, a specific aspect of youth employment. In Quebec, the Act respecting child labour limits the work of school-aged children and young people aged fourteen to sixteen to seventeen hours per week (with a maximum of ten hours from Monday to Friday). <sup> 42 </sup> It sets the minimum age for admission to employment at fourteen. However, exceptions to the minimum age for admission to employment are relatively numerous, and while the Act provides for penalties for offending employers, it does not include direct incentives to protect young people's sleep. Recent recommendations from the American National Sleep Foundation <sup>24</sup> emphasize the need to collaborate with workplaces to establish protective guidelines for young people's sleep, particularly by avoiding late shifts.
To mobilize and take action
Sleep-friendly habits appear to be poorly understood among adolescents. 8 Strengthening knowledge about sleep-friendly practices is a first step in supporting the adoption of healthier sleep habits among adolescents, although improved knowledge alone is not enough to bring about lasting change. 43
The school environment represents a prime opportunity for promoting sleep, as it allows access to a large pool of young people at a key stage in the development and routinization of sleep-wake rhythm behaviors. The World Health Organization considers school-based health programs to be among the most effective interventions for improving the health and well-being of young people<sup> 44</sup> when they target cross-cutting issues such as sleep. Educational programs in schools have been proposed to improve young people's sleep. While their effects on sleep-related knowledge are quite convincing, their ability to bring about changes in sleep habits remains variable and generally modest. Research to date suggests that the most promising programs would be based on interactive approaches, integrated into the school curriculum, target both knowledge transfer and behavioral change, and offer adolescents concrete tools and realistic strategies for adapting their sleep routines to the constraints of daily life.<sup> 43,45,46</sup>
Conclusion
More evidence is still needed to identify the key ingredients for successful interventions targeting the challenges identified in this study. Considering established practices in health promotion, we can expect a beneficial effect from interventions that foster motivation for change as well as levers for action that, beyond behavioral factors, take into account the family environment and the structural components that structure and sometimes constrain a young person's day.
We hope that this work will resonate with the stakeholders involved (young people, parents, school staff and public health actors) so that they all mobilize to promote the sleep of young people, this determinant too often neglected of their quality of life.
References
- Bommersbach TJ, Olfson M, Rhee TG. Insufficient Sleep Among US Adolescents Across Behavioral Risk Groups. JAMA. Apr 7 2026;335(13):1173-1176. doi:10.1001/jama.2026.1417
- Public Health Agency of Canada. YOUTH HEALTH IN CANADA: A Portrait of Mental Health. Findings from the 2022 Health Behaviours Survey of School-Aged Youth. 2025. https://www.canada.ca/content/dam/phac-aspc/documents/services/publications/science-research-data/young-people-canada-focus-mental-health/jeunes-canada-portrait-sante-mentale.pdf
- Cosma A, Abdrakhmanova S, Taut D, Schrijvers K, Catunda C, Schnohr C. A focus on adolescent mental health and well-being in Europe, central Asia and Canada. Health Behavior in School-aged Children international report from the 2021/2022 survey. Flight. 1. 2023. https://www.hbsc.org/publications/reports/a-focus-on-adolescent-mental-health-and-well-being-in-europe-central-asia-and-canada/
- Centers for Disease Control and Prevention. Youth Risk Behavior Survey Data Summary & Trends Report for Dietary, Physical Activity, and Sleep Behaviors: 2013–2023. 2025. https://www.cdc.gov/yrbs/dstr/pdf/DSTR-Dietary-PhysicalActivity-SleepBehavior 2013-2023-508.pdf
- Traoré I, Simard M, Julien D. Quebec Survey on the Health of Secondary School Students. Results of the Third Edition – 2022-2023. 2024. https://statistique.quebec.ca/fr/fichier/enquete-quebecoise-sante-jeunes-secondaire-2022-2023.pdf
- Quebec National Institute of Public Health. Public Health Indicator: Sleep Among Young People. Quebec National Institute of Public Health. Accessed April 28, 2026, https://www.inspq.qc.ca/indicateur/habitudes-de-vie/jeunes-secondaire-sommeil
- Sunil S, Tamadala SB, Arun G, Rana S, Prasad BV, Seema N. Sleep and Emotion in Adolescents: A Systematic Review of Studies Using Polysomnography, Actigraphy and Fitbit Data. Annals of neuroscience. 2026:09727531261419490.
- Walker M. Why We Sleep. Unlocking the power of sleep and dreams. Scribner; 2018.
- Bates RA, Location TA. Insufficient Sleep in Adolescents and the Need for System Changes. JAMA. 2026;335(13):1125-1126. doi:10.1001/jama.2026.1717
- Quebec Institute of Statistics. Quebec Survey on the Health of Secondary School Students. Results of the Third Edition
– 2022-2023. 9 - Sleep. - Tézier B, Haddad S, Bélanger RE, Bacque Dion C, Leatherdale S, Turcotte-Tremblay AM. Associations between types of screen use and bedtimes among a large sample of adolescents: Age and bedtime specific variations from the COMPASS study. BMC Public Health. under review;doi:doi.org/10.21203/rs.3.rs-8704490/v1
- Poirier K, Gauvin L, Haddad S, Belanger RE, Leatherdale ST, Turcotte-Tremblay AM. Evolution of Sleep Duration and Screen Time Between 2018 and 2022 Among Canadian Adolescents: Evidence of Drifts Accompanying the COVID-19 Pandemic. J Adolesc Health. May 2024;74(5):980-988. doi:10.1016/j.jadohealth.2023. 12.023
- Reichenberger DA, Master L, Mathew GM, et al. Interactive Screen-Based Activities Predict Worse Actigraphic Sleep Health That Night Among Adolescents. Journal of Adolescent Health. 2024;74(4):774-781. doi:10.1016/j.jadohealth.2023.10.027
- Alam M, Abbas K, Sharf Y, Khan S. Impacts of Blue Light Exposure From Electronic Devices on Circadian Rhythm and Sleep Disruption in Adolescent and Young Adult Students. Chronobiol Med. 3 2024;6(1):10-14. doi:10.33069/cim.2024.0004
- Verhulst S, Vidal Bustamante CM, Carvajal-Velez L, et al. Toward a Demand-Driven, Collaborative Data Agenda for Adolescent Mental Health. J Adolesc Health. 2023;72(1S):S20-S26. doi:10.1016/
j.jadohealth.2022.05.027 - Grandner MA. Social-ecological model of sleep health. Sleep and health. Elsevier; 2019:45-53.
- Pulimeno M, Piscitelli P, Colazzo S, Colao A, Miani A. School as ideal setting to promote health and wellbeing among young people. Health Promot Perspective. 2020;10(4):316-324. doi:10.34172/hpp. 2020.50
- Chaput JP, Janssen I. Sleep duration estimates of Canadian children and adolescents. J Sleep Res. Oct 2016;25(5):541-548. doi:10.1111/jsr.12410
- Canadian Society for Exercise Physiology (CSEP). Canadian 24-Hour Movement Guidelines for Children and Youth (5-17 years): An integrated approach encompassing physical activity, sedentary behaviour, and sleep. https://guidelinescpe.ca/guidelines/children-and-youth-2/
- Poirier K, Turcotte-Tremblay AM, Bélanger R, et al. Inequality of Adolescents' Mental Health between 2018 and 2023: Repeated Cross-sectional Evidence from COMPASS. 2025; doi:https://doi. org/10.21203/rs.3.rs-6933580/v1
- Clarke P, Erreygers G. Defining and measuring health poverty. Social Science & Medicine. 2020/01/01/2020;244:112633. doi:https://doi.org/10.1016/j.socscimed.2019.112633
- Williams R. Generalized Ordered Logit/Partial Proportional Odds Models for Ordinal Dependent Variables. The StataJournal. 2006;6(1):58-82. doi:10.1177/1536867X0600600104
- StataCorp L. Stata Statistical Software: Release 19. StataCorp LLC; 2025.
- Dautovich ND, Gunn HE, Dzierzewski JM, et al. Adolescent sleep health: Recommendations from the National Sleep Foundation. Sleep Health: Journal of the National Sleep Foundation. 2026;12(2):355-365. doi:10.1016/j.sleh.2026.01.002
- Humphreys J, Atkinson C. Adolescent Cannabis Use - Motives, Frequency and Consequences: A Systematic Literature Review. Journal of Child & Adolescent Substance Use. 2025/05/04 2025;30(3):83-102. doi:10.1080/29973368.2025.2458854
- Hartstein LE, Garrison MM, Lewin D, Boergers J, LeBourgeois MK. Characteristics of Melatonin Use Among US Children and Adolescents. JAMA Pediatrics. 2024;178(1):91-93. doi:10.1001/jamapediatrics.2023.4749
- Luguri J, Strahilevitz LJ. Shining a Light on Dark Patterns. Journal of Legal Analysis. 2021;13(1):43-109. doi:10.1093/jla/laaa006
- Haidt J. The Anxious Generation: How the great rewiring of childhood caused an epidemic of mental illness. Penguin Press; 2024.
- Bonenfant M, Delorme S, Dumont A, Duchaineau C. Video games for children. Understanding them to choose them better. 2024.
- Pereira EF, Moreno C, Louzada FM. Increased commuting to school time reduces sleep duration in adolescents. Chronobiol Int. Feb 2014;31(1):87-94. doi:10.3109/07420528.2013.826238
- Pradhan RK, Sinha N. Impact of Commuting Distance and School Timing on Sleep of School Students. Sleep and Biological Rhythms. 2017;15:153-158. doi:10.1007/s41105-017-0091-0
- Seta D, Otsuka Y, Tokiya M, Saitoh I, Itani O, Kaneita Y. Relationship between commuting to school and sleep disturbance in Japanese adolescents: a 2-year cohort study. Sleep Med. Dec 2025;136:106846. doi:10.1016/j.sleep.2025.106846
- Matawan, National Association for Educational Transport in Public Schools. School Transport: What Impact on Students' Daily Lives? Summary of the Matawan/ANATEEP Study. 2026. https://matawan-mobility.com/wp-content/uploads/2026/01/Synthese-etude-anateep-matawan.pdf
- Gariepy G, Janssen I, Sentenac M, Elgar FJ. School start time and sleep in Canadian adolescents. J Sleep Res. Apr 2017;26(2):195-201.doi
:10.1111/jsr.12475 - Meltzer LJ, Wahlstrom KL, Plog AE, Strand MJ. Changing school start times: impact on sleep in primary and secondary school students. Sleep. 2021;44(7)doi:10.1093/sleep/zsab048
- Owens JA, Dearth-Wesley T, Herman AN, Oakes JM, Whitaker RC. A quasi-experimental study of the impact of school start time changes on adolescent sleep. Sleep Health. Dec 2017;3(6):
437-443 doi:10.1016/j.sleh.2017.09.001 - Widome R, Berger AT, Iber C, et al. Association of Delaying School Start Time With Sleep Duration, Timing, and Quality Among Adolescents. JAMA Pediatr. Jul 1 2020;174(7):697-704. doi:10.1001/jamapediatrics.2020.0344
- Adolescent Sleep Working G, Committee on A, Council on School H. School start times for adolescents. Pediatrics. Sep 2014;134(3):642-9. doi:10.1542/peds.2014-1697
- National Research Council & Institute of Medicine. Protecting Youth at Work: Health, Safety, and Development of Working Children and Adolescents in the United States. 1998.
- OECD. Teenage Part-Time Working: How Schools Can Optimize Benefits and Reduce Risks for Secondary School Students. OECD Education Policy Perspectives, No. 116. 2025.
- Breslin C, Koehoorn M, Smith P, Manno M. Age related differences in work injuries and permanent impairment: a comparison of workers' compensation claims among adolescents, young adults, and adults. Occupy Environ Med. 2003;60(9):E10. doi:10.1136/oem.60.9.e10
- Government of Quebec. Act respecting the regulation of child labour (SQ 2023, c. 11).
- Blunden SL, Chapman J, Rigney GA. Are sleep education programs successful? The case for improved and consistent research efforts. Sleep Med Rev. Aug 2012;16(4):355-70. doi:10.1016/j. smrv.2011.08.002
- World Health Organization and the United Nations Educational Scientific and Cultural Organization. Making every school a health-promoting school: global standards and indicators for health-promoting schools and systems. 2021.
- Blunden S, Rigney G. Lessons Learned from Sleep Education in Schools: A Review of Dos and Don'ts. J Clin Sleep Med. Jun 15 2015;11(6):671-80. doi:10.5664/jcsm.4782
- Illingworth G, Sharman R, Harvey CJ, Foster RG, Espie CA. The Teensleep study: the effectiveness of a school-based sleep education program at improving early adolescent sleep. Sleep Med X. Dec 2020;2:100011. doi:10.1016/j.sleepx.2019.100011
- Gaskin CJ, Venegas Hargous C, Stephens LD, et al. Sleep behavioral outcomes of school-based interventions for promoting sleep health in children and adolescents aged 5 to 18 years: a systematic review. Sleep Adv. 2024;5(1):zpae019. doi:10.1093/sleepadvances/zpae019
- Gruber R. Evaluating school-based sleep health promotion programs in real life. Sleep Health. Apr 2020;6(2):135-136. doi:10.1016/j.sleh.2020.02.007
Appendices
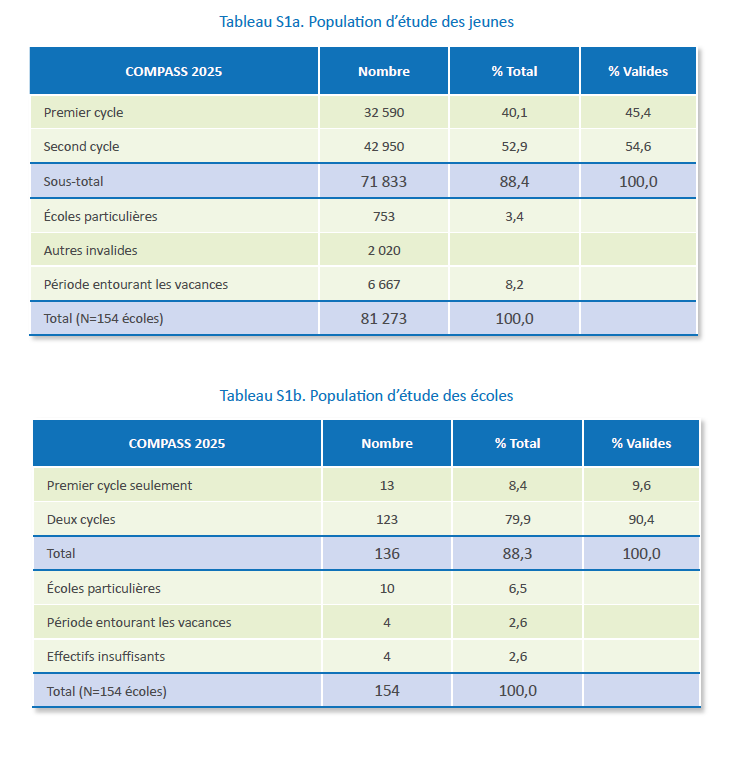
Suggested quote
Haddad S, Bélanger RE, Poliakova N, Tézier B & Turcotte-Tremblay AM. Going to bed late, getting up early, and sleep deprivation: Analysis of the sleep needs of young people in the COMPASS-Québec 2025 survey. Research report/note No. 7. VITAM Research Centre. Quebec City, May 2026.
Funding
COMPASS-Québec benefits from research grants and support from the Ministry of Health and Social Services, the Government of Quebec and the Canadian Institutes of Health Research.