News by audience
- Current students (3)
- Future students (2)
- Faculty (3)
- Staff (3)
News archive
Wednesday, May 14, 2014
The Geospatial Centre is excited to announce the recent acquisition of the LandScan Global Population Database, which features the highest-accuracy population data available on the market. Developed at the U.S. Department of Energy’s Oak Ridge National Laboratory, the population data is broken down into three levels:
- countries,
- first-level administrative boundaries (i.e. provinces, states), and
- square-kilometre cells.
This dataset has a wide range of applications across numerous fields, including business, planning, health and humanitarianism, and more.
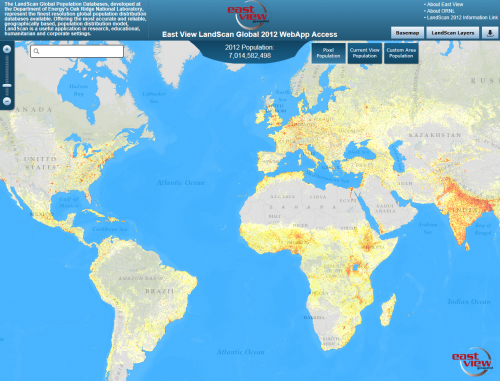
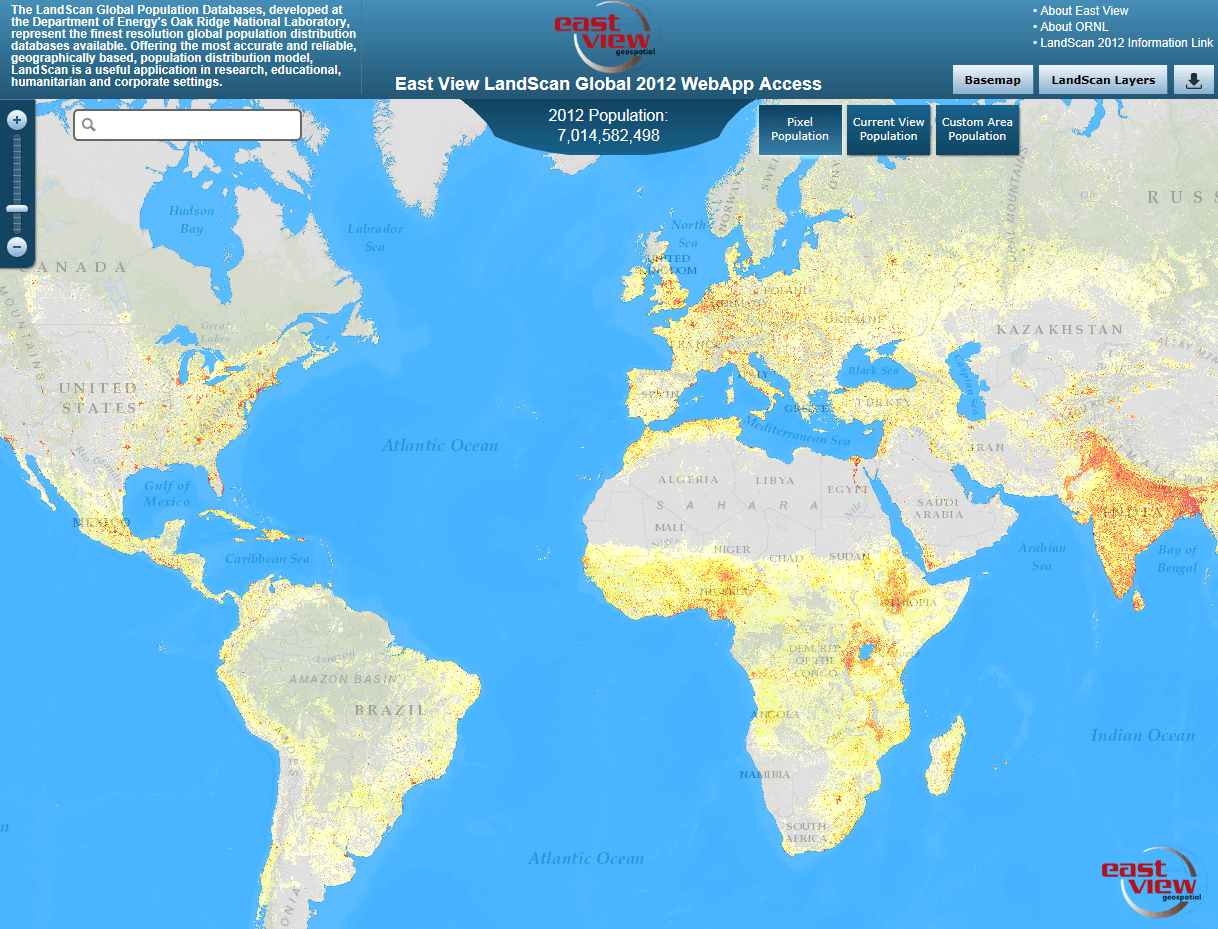
World population distribution at a glance. In 2012, the world’s population reached over 7 billion, mapped in LandScan by square-kilometre with darker reds signifying higher populations.
Download image (PNG).
Cloud-based maps and tools
The LandScan products include raw data files in raster format as well as a cloud-based web mapping service (WMS). Both of these products can be used with GIS software; however, the cloud-based WMS can also be accessed online as a mapping application. This option is ideal for casual users and for quick access to the information and tools. For example, you can find the population of a single cell (1 sq-km) by clicking on the “Pixel Population” button and then on the pixel of interest. The result is given as a population count (not to be confused with population density, which can, however, be determined using the raw data and GIS software), and the click also provides population data in two pop-up windows: one for the administrative boundary that the cell belongs to, the other for the country.
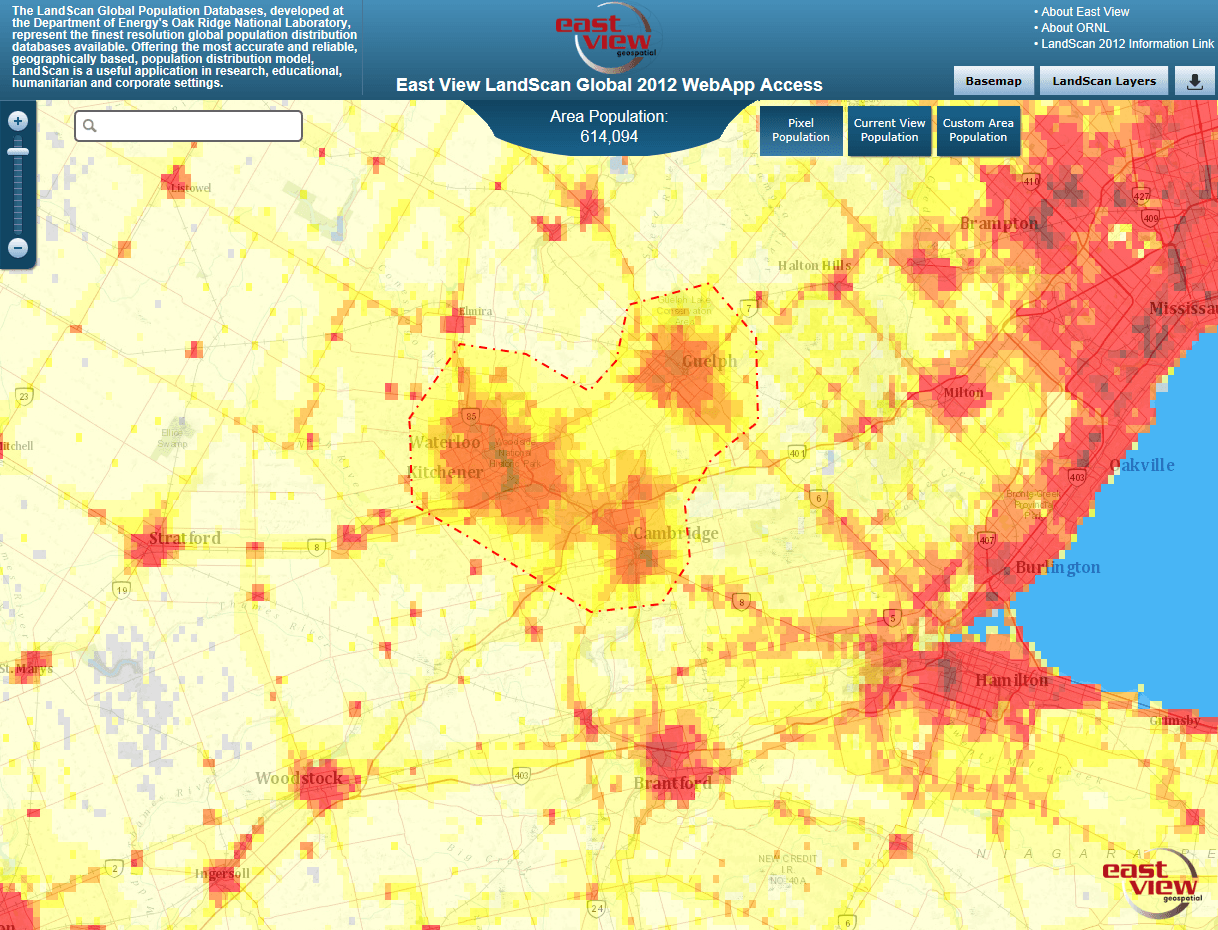
Users can also get the population count for the area visible on the map by using the “Current View Population” button, or they can use the “Custom Area Population” button to get a unique population count within a user-defined boundary. Additional tools allow users to download population data by country or by custom area, both providing a raster data file that can be used with GIS software.

A custom population count (just over 600,000) for the area inside the dotted line, surrounding Kitchener, Waterloo, and Guelph, Ontario.
Download image.
Data collection and archives
Because the data covers every square-kilometre of land and features the highest level of detail for global population, LandScan is compiled and produced at the beginning of each year using the previous year’s data. The final product is then released around September of that year. Therefore, the most current version of LandScan is 2012 (2013 data is currently being processed for release in the fall). However, this version is also the 14th iteration, meaning LandScan has been produced since 2000, and the Library has acquired the archive as well as the 2012 data.
As data collection methods have improved over time (especially in developing parts of the world where censuses are not conducted), so has the LandScan database. For this reason, the publishers caution users against cell-by-cell comparison between different versions of LandScan. The value of the archived data lies more in the fact that for its time, it too was the most accurate global population data available; therefore, using the data for a specific area in a given year (i.e. Fukushima, Japan, prior to the 2011 earthquake and tsunami) would be a more appropriate use of the previous versions.
Painting a population picture
Although reminiscent of the popular “world at night” satellite images, which give a visual sense of population densities, LandScan provides an even more accurate picture because it accounts for parts of the world that do not have the infrastructure to support nighttime lighting.
The Geospatial Centre invites you to explore the data and learn things about the world’s population you wouldn’t have imagined.
For more information, contact:
Talsan Schulzke
GIS Specialist
519-888-4567, ext. 38985


