Design team member: Leng Limmany
Supervisor: Dr. Paul Fieguth
Background
In the world of finance, money managers are presented with the task of handling large sums of money given to them by individuals and organizations. They use this money to make investments on a variety of assets available to them such as stocks, bonds commodities and their respective derivatives. In order to allocate these funds successfully, the manager must develop and implement strategies using a combination of quantitative and qualitative techniques.
Pattern classification and parameter estimation are quantitative tools used to build “fuzzy” models that determine the relationship of one variable with another. Instead of finding a general relationship expressed as a single numerical constant between two variables, pattern classification techniques further subdivide the view of this parametric relationship into behaviour based group levels. This is accomplished by finding the values of a variable in which the response to the dependent variable are the same. These values are then grouped together to form a level that distinctively triggers an identified response in the dependent variable. The objective is to obtain small differences within the groups, but large differences among the groups so that distinct behaviour patterns can be deduced given any arbitrary value for the independent variable. This can potentially be very powerful and versatile in uncovering hidden relationships in financial forecasting. Due to the seemingly random nature of the financial system, it is difficult to conduct analysis and prediction using conventional linear techniques. This workshop is to uncover potential models within financial data based on intelligent pattern recognition.

Figure 1: Triangle Price Trend
Project description

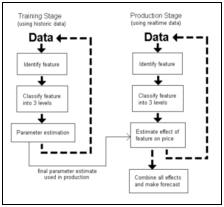
Figure 2: System and data interaction
The system will be working with data in two phases – training and production. In the training stage, the system will be “trained” to recognize patterns and relationships between features and price movements based on historic data. This will incorporate the identification of the feature, classifying the feature into 3 levels, and parameter estimation of the feature class. In the production stage, the system will use its knowledge about the relationships found in the training stage (via the parameter estimates) and forecast the effects of a set of features that occur at any particular time on the price at a given time. These effects will be combined to produce an overall effect and thus and overall forecast of the price of a given stock. Real-time data will be fed through the system where features will be extracted, classified into the three levels, and an effect on the price will be given.
Design methodology
The design methodology can be broken down into the following steps:
1. Find financial data sources
2. Develop working models that identify relationships between features and price change
3. Develop an intelligent model selection process
4. Develop a backtest environment where actual financial data can be used to test the resulting system.