News by audience
- Current students (3)
- Future students (2)
- Faculty (3)
- Staff (3)
News archive
Friday, August 11, 2017
In celebration of the University of Waterloo's 60th anniversary and Canada's 150th year since confederation, the Library's Geospatial Centre has created a graphic visualization of the City of Waterloo's population growth, from 1855 to 2016.
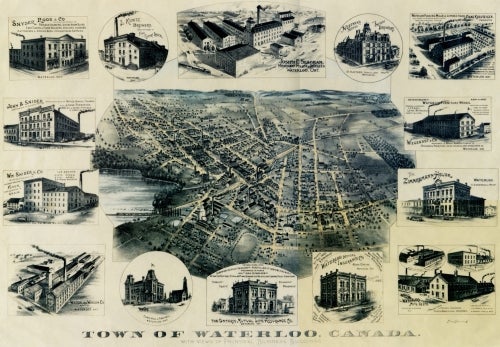
Town of Waterloo, Canada, 1891. Located in the Geospatial Centre.
Using the ArcGIS Story Maps application, you can see the increase in Waterloo's population over the years in an animation combining historical maps of Waterloo with census and gazetteer data.
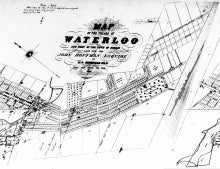
Map of the Village of Waterloo, 1855. Located in the Geospatial Centre.
The village that became Waterloo was established in 1806 by Abraham Erb, and in 1816 was named in honour of the Duke of Wellington's victory over Napoleon at the Battle of Waterloo. After the Napoleonic Wars, the area became a popular destination for German immigrants, and the population grew to around 1,100 by 1855.
In many ways, the population growth tells the story of the region's industries. By 1891, Waterloo was already a mid-sized village of craft workers with a high level of urbanization. Due to a growing furniture and upholstery industry, less than half of the population lived in rural areas.
The population surged again leading up to World War II, with many people looking for work in the booming industries of the region – particularly Cambridge.
By 1965, Waterloo was becoming a scholarly hub, with the University of Waterloo and what is now Wilfrid Laurier University established. The tech boom of the 1990s saw noticeable growth in the university corridor, which continues to this day. The effect of the university community in the city is seen in the continued development of student high-rises and neighbourhoods. A history of 60 years of innovation at University of Waterloo is now writing the story of the growth of the City of Waterloo itself.
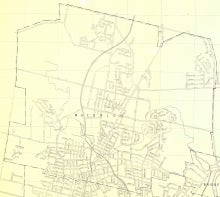
Map of Waterloo, 1965
Visit the Population Growth of Waterloo Story Map to learn more about this project and the data and maps behind it. You can also learn more about the history of the city by viewing the historical maps and aerial photos online, or see them in person at the Geospatial Centre.


