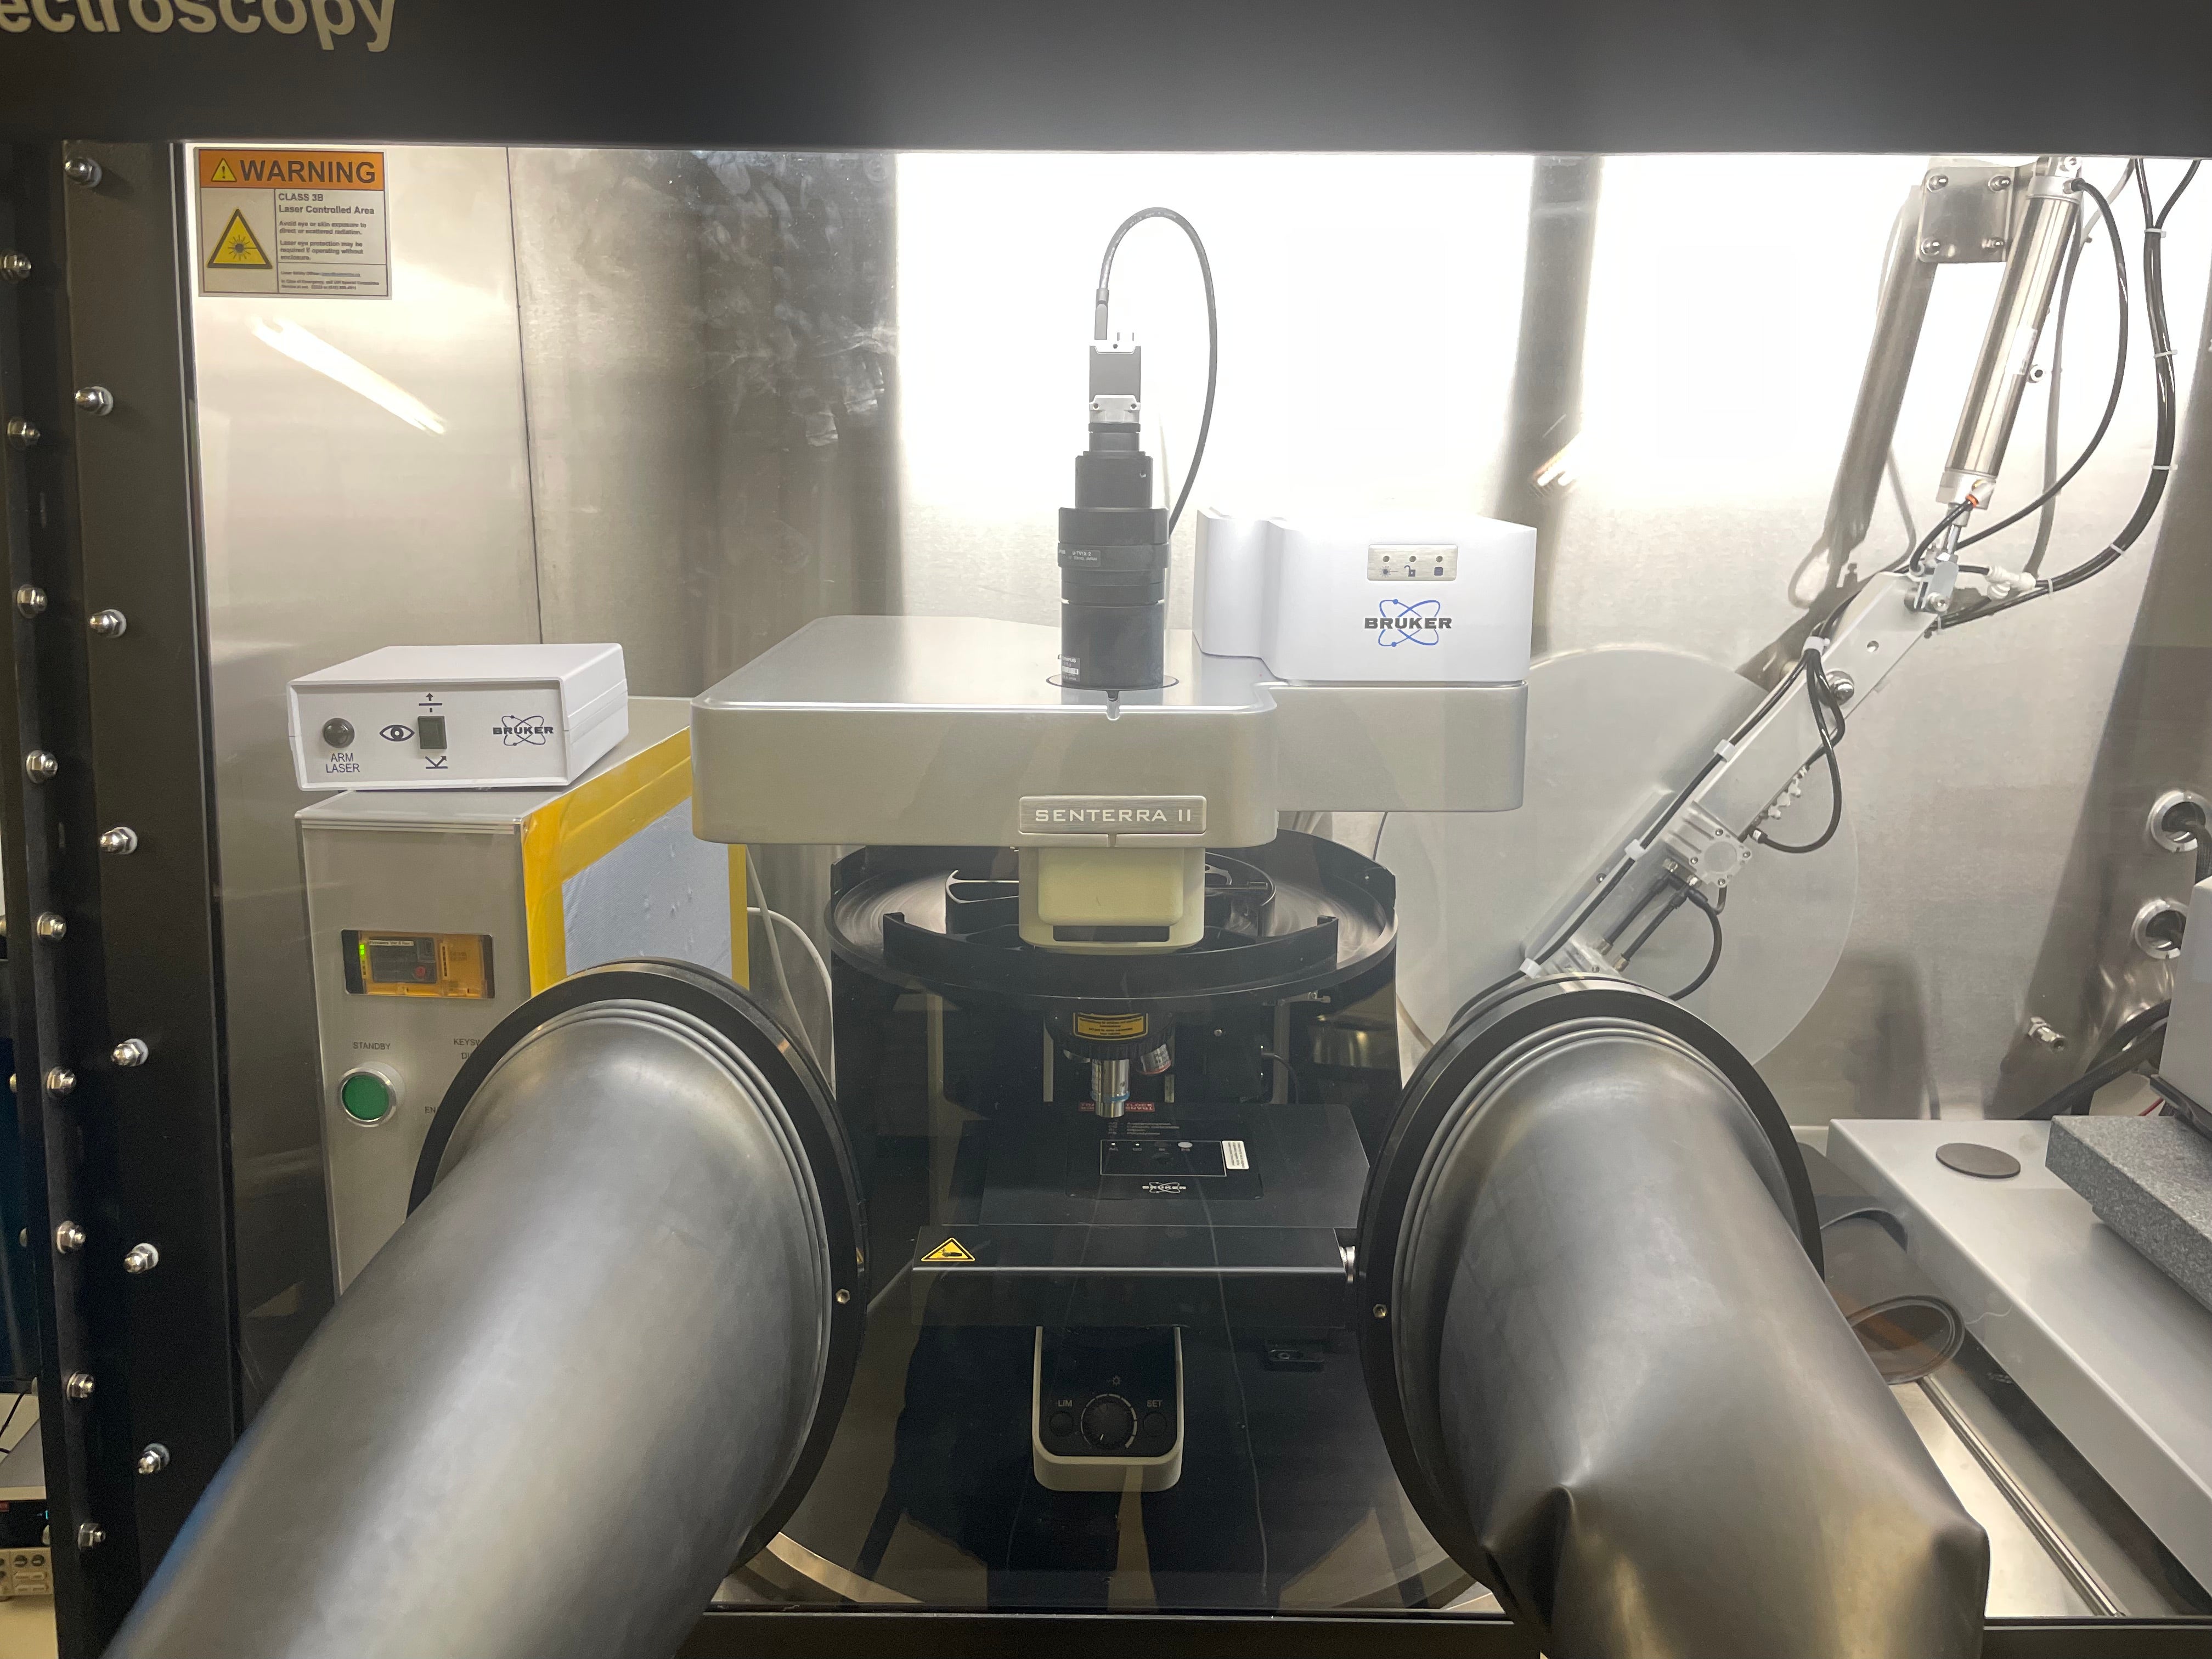
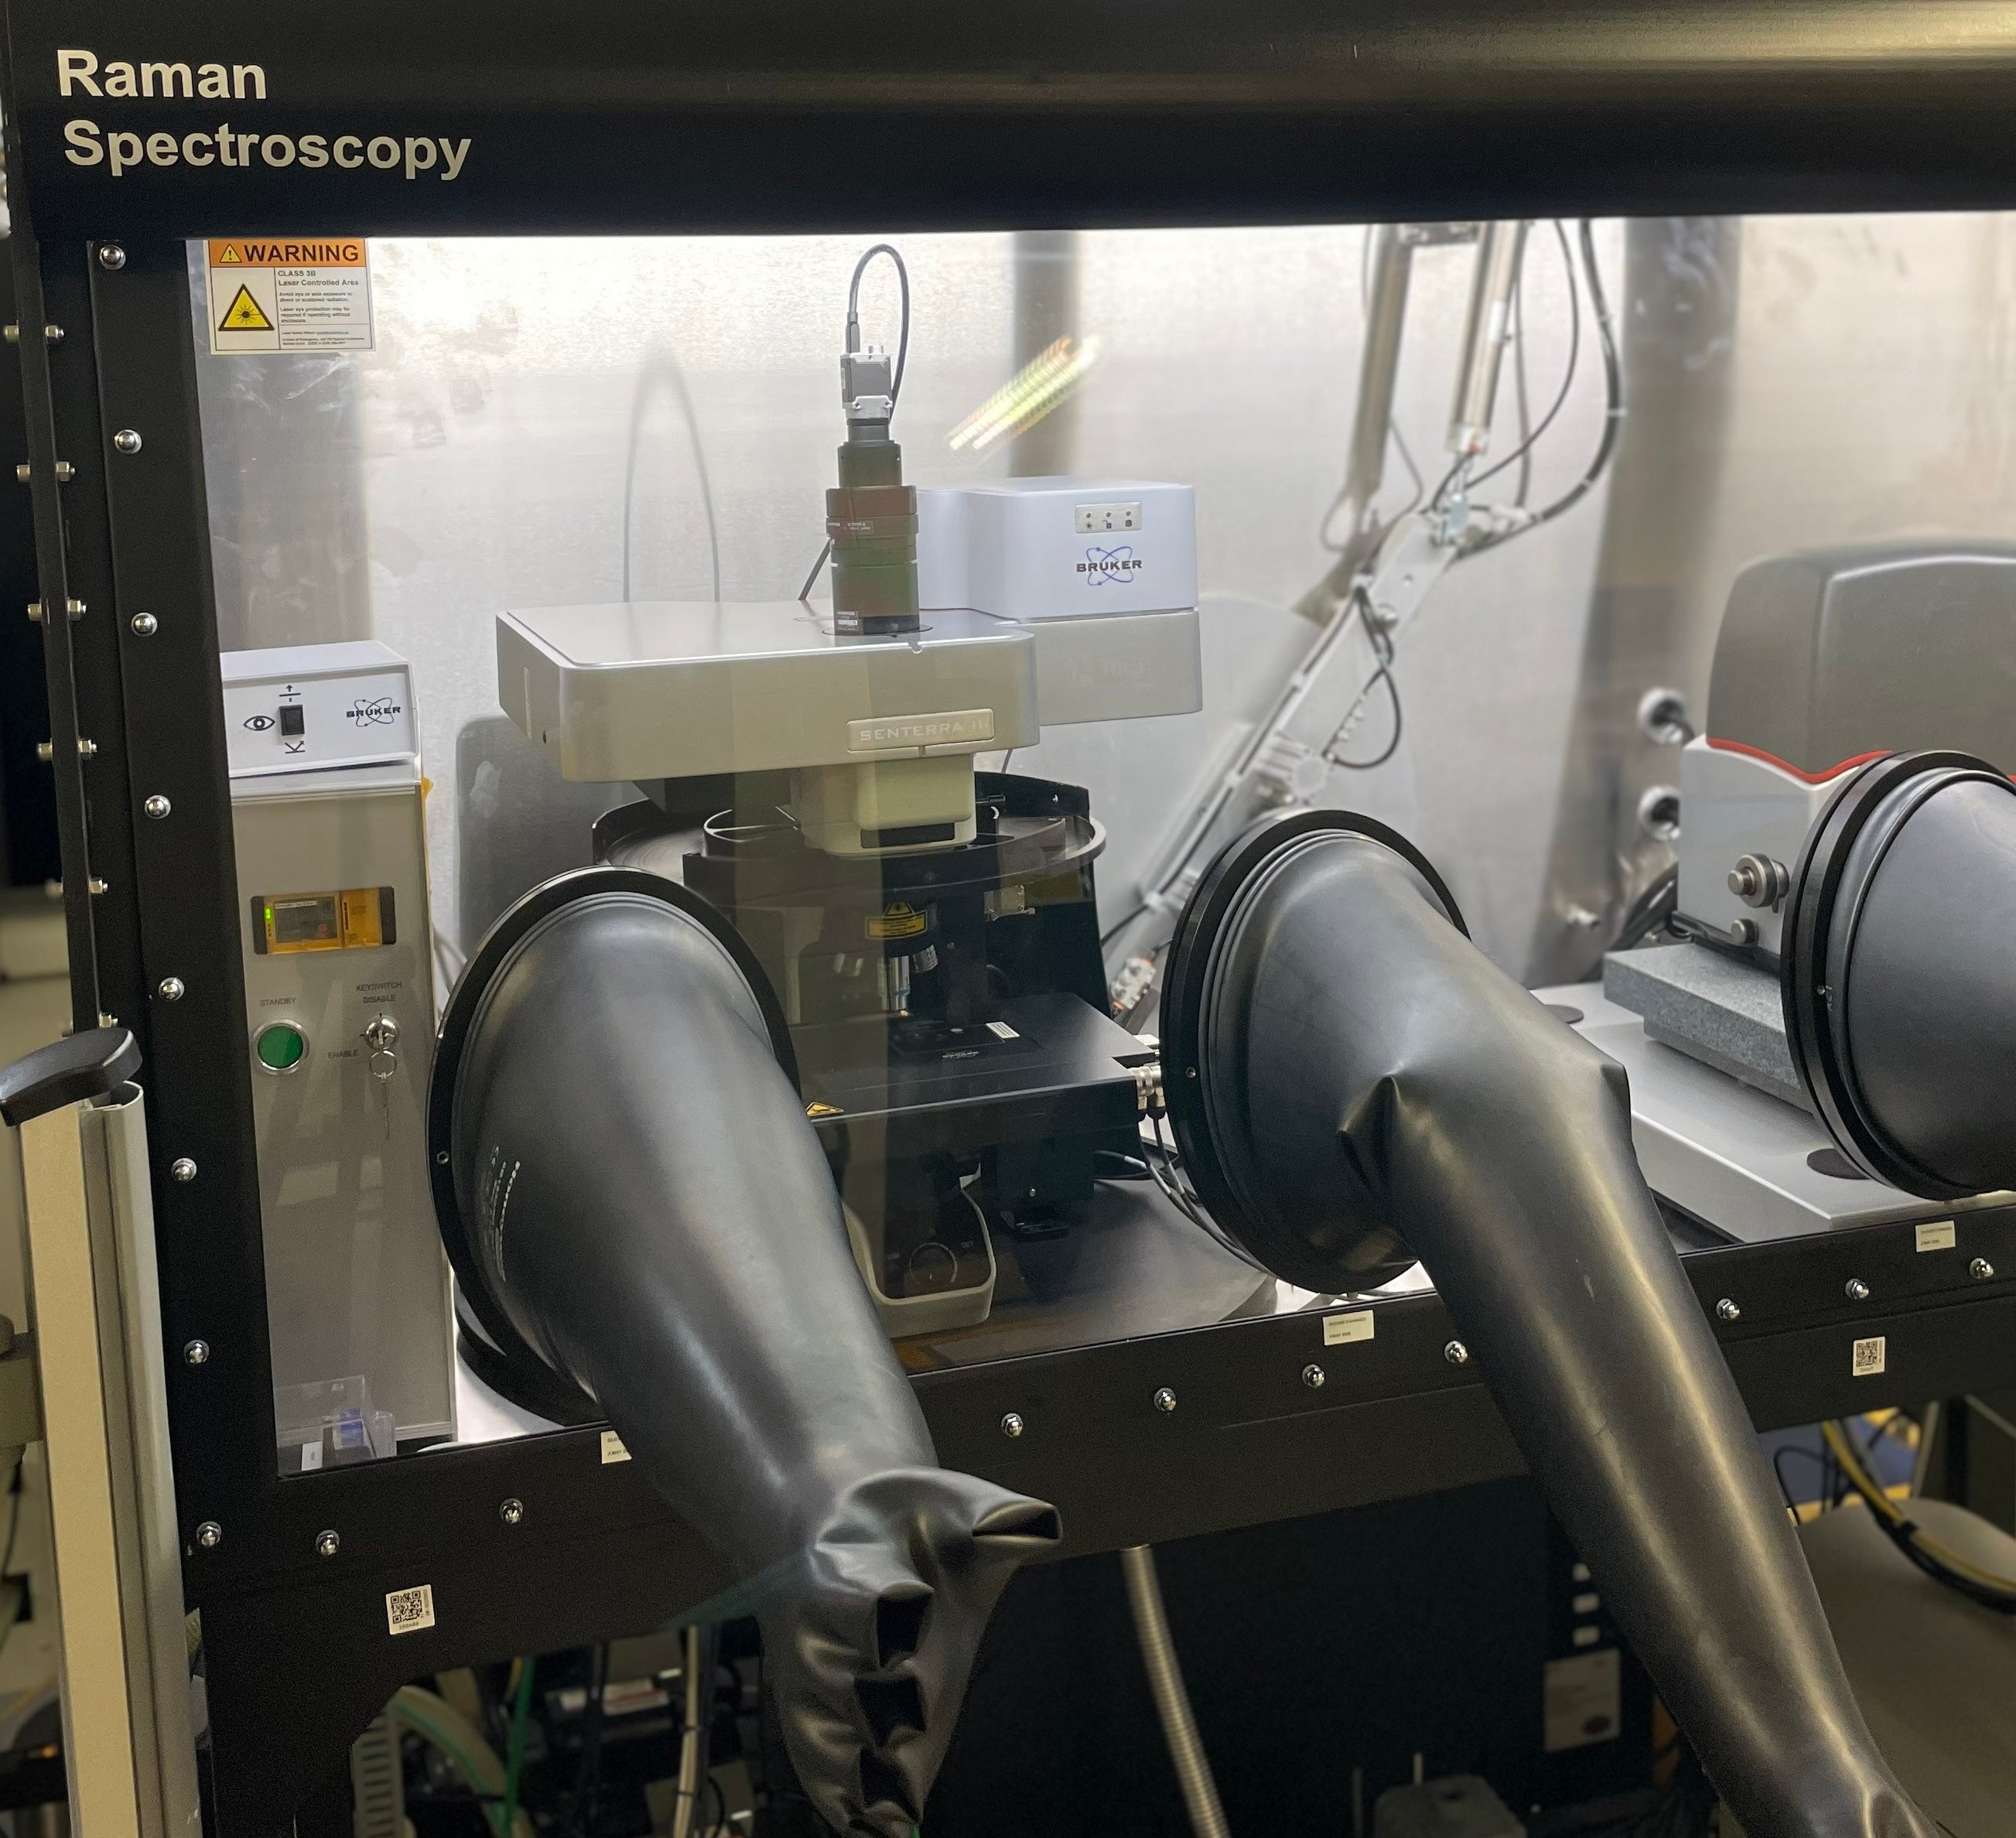
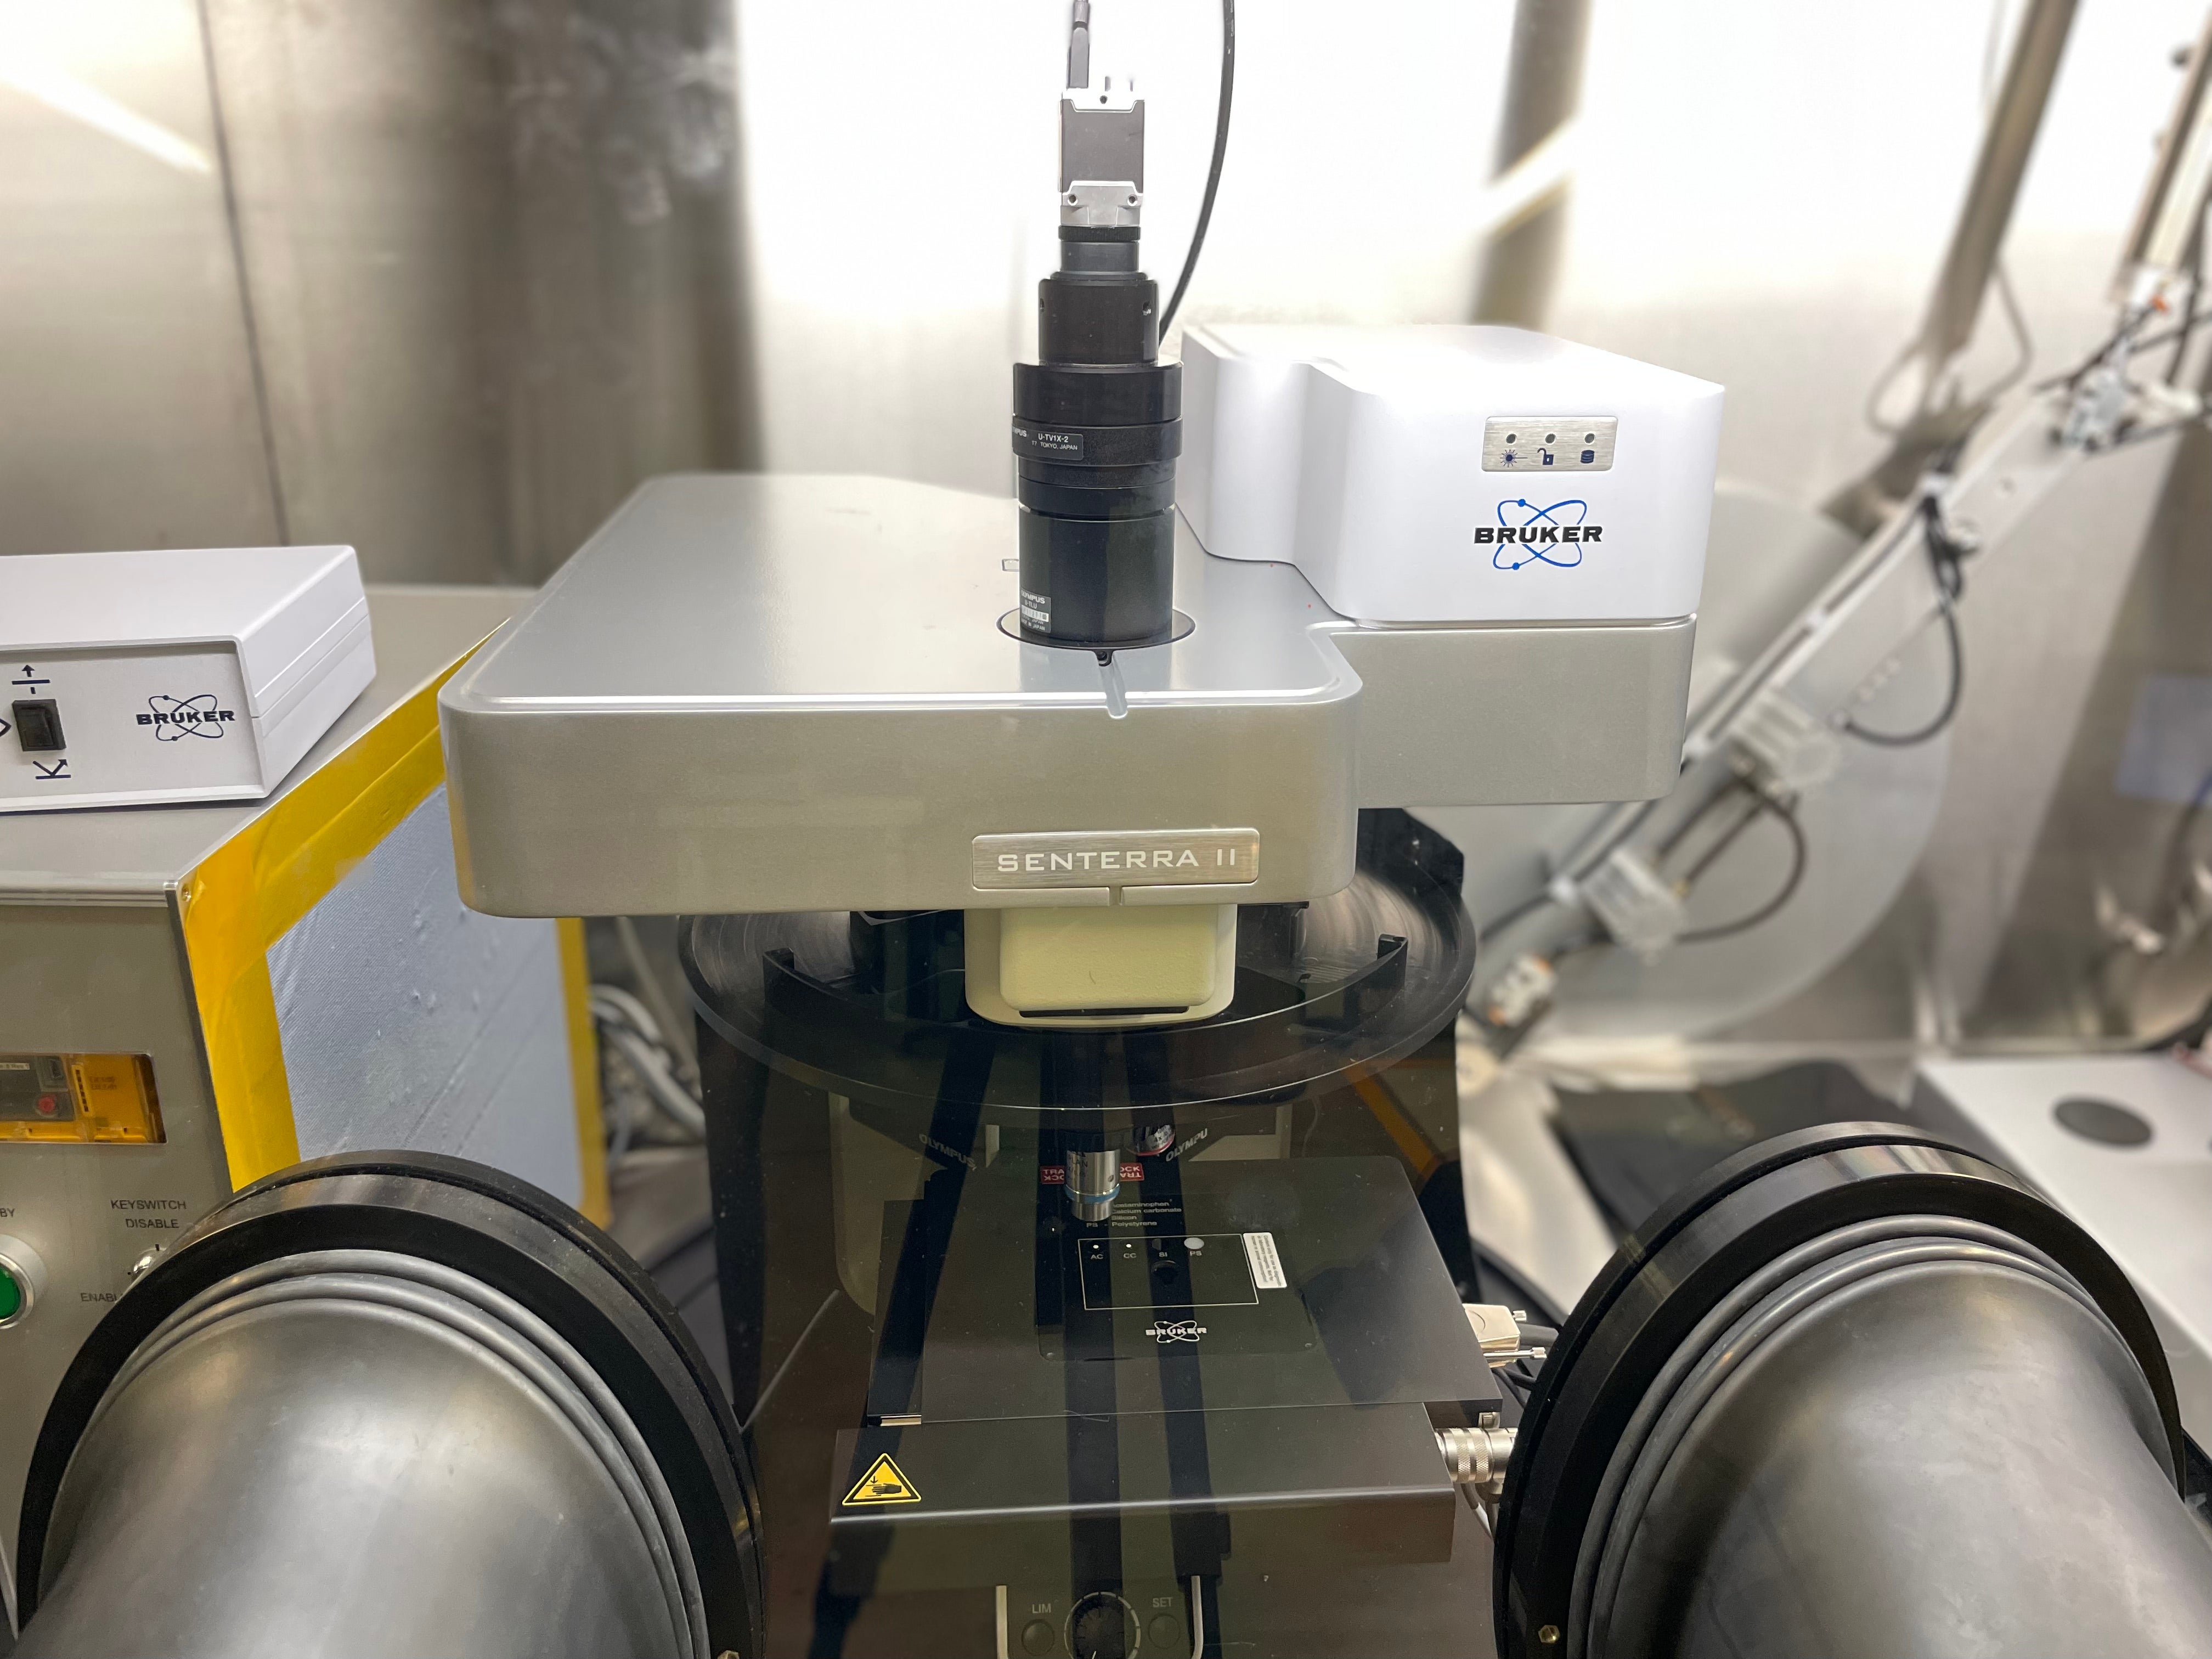
The Quantum-Nano Fabrication and Characterization Facility (QNFCF) is now pleased to offer user training and support for the new Bruker SENTERRA-II Raman Microscope system in the Research and Advancement Centre 1 (RAC 1). The addition of this versatile mapping spectrometer to the N2 glovebox system, alongside the Innova AFM, JEOL IT-510 SEM and Olympus 2D assembly microscope enables fast and comprehensive characterization of air-sensitive materials and 2D device architectures.
The system features:
- Choice of 4 X, 20 X, 50 X, 100 X objectives
- Dual wavelength excitation: 785 nm (100 mW) and 532 nm (25 mW)
- Laser power control: 100%, 50%, 25%, 10%, 1%
- High precision motorized 50 mm X 75 mm sample stage with 50 nm minimum step width
- Choice of two gratings for high resolution (1200 l/mm) or wide spectral range (400 l/mm)
- Integrated half-waveplate and analyzer for polarization-dependent measurements on 532 nm laser line
- Optional photoluminescence mode
This new shared capability has been made available to the Waterloo community and beyond through the support of the Transformative Quantum Technologies (TQT) program.
Interested researchers are encouraged to send their new project inquiries to Sandra Gibson.


Application: Graphene layer identification
The sub-micron chemical mapping functionality allows for the visualization of the distribution of different phases, layers, strains, or defects across various material systems. For exfoliated graphene layers on silicon, the number of layers can be visualized using the characteristic ratio of the so-called 2D-band to the G-band peaks in the Raman spectra.
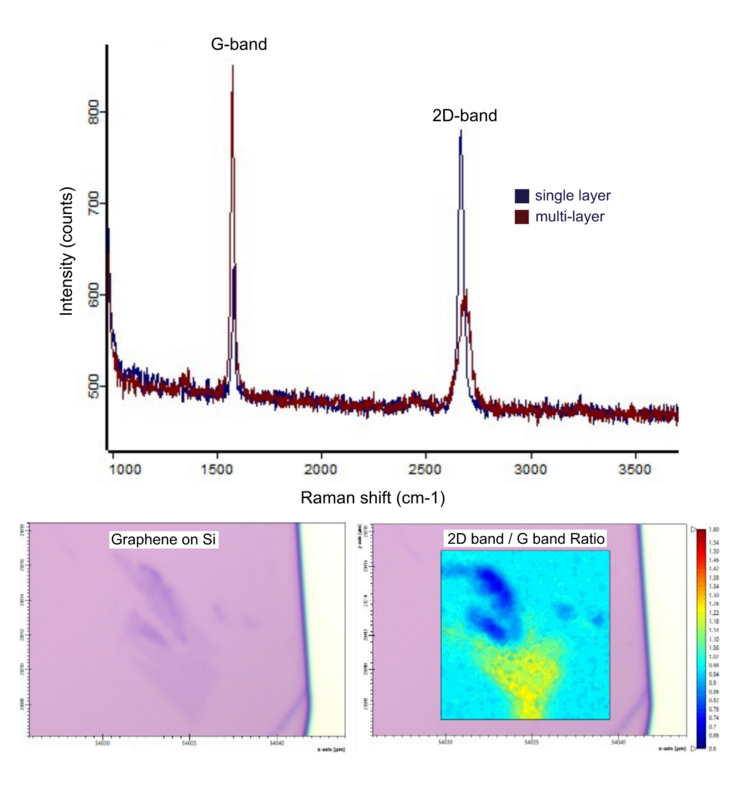
Graphene layer thickness can be visualized here by mapping the 2D/G band peak integral. The final 10µm x 10µm map is composed of 2.5k individual Raman spectra collected in a total of 5 minutes.