How to use Remark Office
Your work computer may have Remark Office installed on it. If you wish to use it:
- Double click on “Remark Office OMR 8 Demo” shortcut.
- Close the “Demo Resources” Window. Then go to file and click on “New Form Template”
- Under the “Form template description”, name your file what you want. Do not touch anything else. Press Next to continue.
- Press “Read from image files”. Then press “Acquire Images from File” and select the “Scantron Exam tester” image. Press OK to finish.
In order to make the grading program work, follow these instructions very carefully:
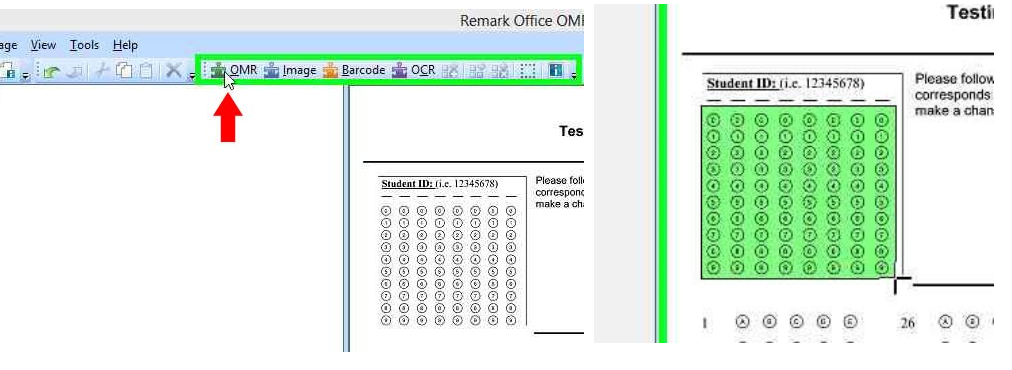
-
After
pressing
"OK"
as
instructed
above,
a new
window
(Remark
Office
OMR
Template
Editor
Demo)
should
appear.
Label
the
StudentID
bubbles
as
not
being
graded.
To
do
that,
press
“OMR”
which
is
near
the
top
of
the
window.
Then,
drag
your
mouse
to
select
the
bubbles.
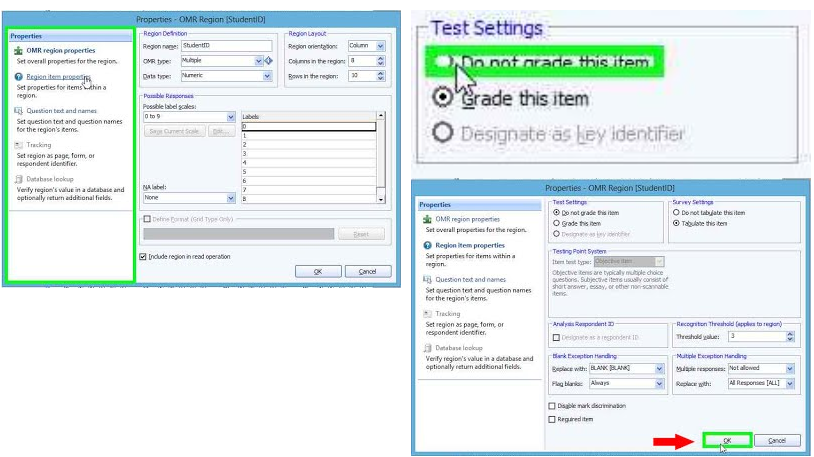
- Another new Window should pop up. Under “Region Definition”, enter "StudentID" under “Region name”. Change “Data type” to numerical since we are using numbers for the grades.
- Under Region Layout, hange “Region orientation” to column because we are selecting one bubble per column. Make the number in “Columns in the region” 8 and “Rows in the region” 10.
- Under “Possible Responses”, change the dropdown for “Possible label scales” to “0 to 9”
-
Under
"Properties",
click
on
“Region
item
properties”.
Then press
“Do
not
grade
this
item”.
Click
OK
to
finish.
-
Now
drag
the mouse
to
the
multiple-choice
questions
that
are
between
1-25.
Make
sure
the
green
rectangle
does
not
touch
the
numbers.
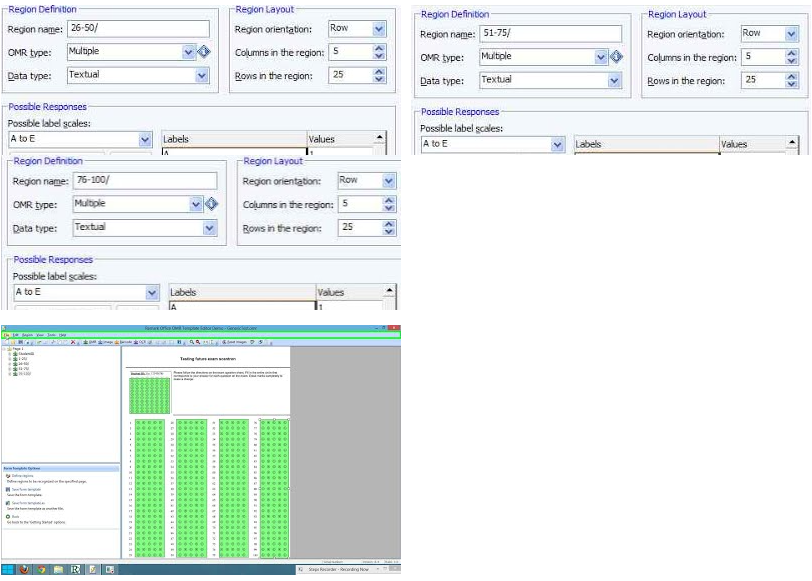
- Change “Region name” to “1-25”, “Columns in the region” to 5, and “Rows in the region” to 25.
- Change “Possible label scales” to “A to E”.
- Press “OK” to finish.
-
If
you
have
more
than
25
questions,
you
can
now drag
the mouse
to
the
multiple-choice
questions
that
are
between
26-50,
51-75
and
76-100,
repeating
the
steps
above.
- Go to file and click ‘save as’ to save this template. Call it anything you want.
How to see how well students did on the test
- Press “Read Wizard” and then press “Read from image files”.
- Press Next and then double click on “Scantron Tester results” Press Next again and then press Read to finish.
Addressing student input mistakes (i.e. bubbling more than one option. Bubbling nothing)
- Press “Review on Exceptions” under Data options. Then press “Begin Review”. One can press the right-arrow button to see more errors. Once you are done, press “finished”.
Grading the results
- Press “Grade Wizard”. A new window should popup.
- Press Next, and then press Next again on the next page.
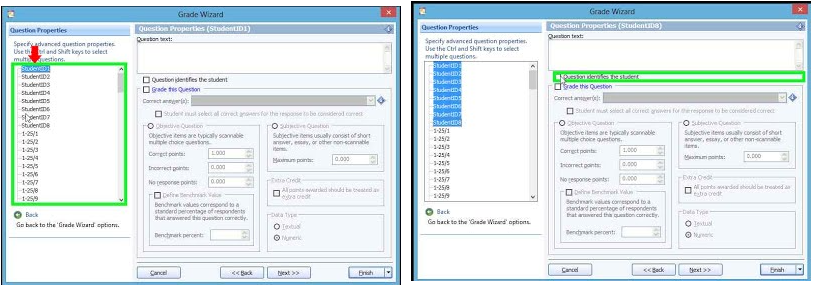
-
Highlight
the
StudentIDs.
One
can
select
them
one
by
one
by
pressing
ctrl
+
left-click
on
each
StudentID.
Or
one
can
left-click
on
StudentID1
and
then
Shift
+
left-click
on
the
last
StudentID to
select
them,
and
all
StudentIDs
in
between.
Fill
in
the
checkmark
“Question
identifies
the
student”
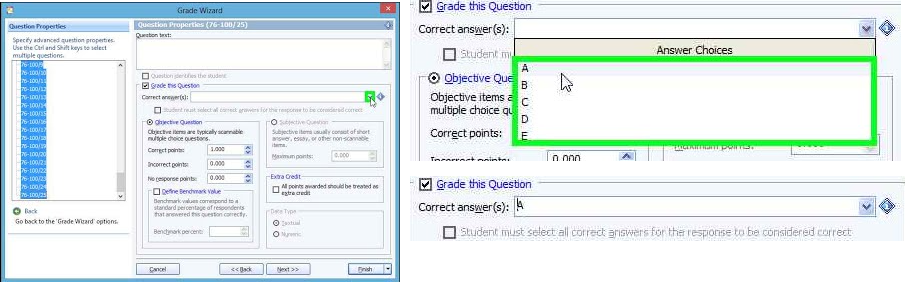
How to select the correct answer for each question
-
In
the
same
box
as
the
StudentIDs,
highlight
the
question
you
want
to
assign
an
answer
to.
Then,
under
the
"Correct
answer(s)"
box,
select
the
letter
answer
you
want
to
be
recorded
as
correct
from
the
dropdown
menu.
- Click Next, next, next and finish to save your changes. You can save this answer key for the later use.
-
Under
Report
Options,
click
on
“Display
Reports”.
There
are
options
to
choose
from:
- “101 – Student statistics Report”. From here we can see the Student ID and their marks.
- “103 – Class Frequency Distribution Report”. Shows a bar graph of the frequent marks.
- “106 – Condensed Test Report”. General information and statistics about the test are reported.
- “107 – Demographic Grade Report”. Can be used to check the number of frequent responses from students.