Design Member: John Baker
Supervisor: Colin Campbell
Go To: Summary | Introduction | Problem definition | Design process | Research | Criteria and constraints | Interface sketches
Summary
The aim of this project is to develop a system capable of receiving the digital output from an electrocardiographic amplifier for: display, analysis, and to store these electrocardiograms (ECGs) electronically for future use and trend analysis on a personal computer.
Furthermore, it is hoped that this system will serve as an educational tool - providing guided tutorials on how to analysis an ECG trace, as well as giving health tips. The overall purpose of creating this system is to take the first step of making important health care sensory devices available to more of the public, as well as to educate and to potentially increase awareness of health issues.
The focus of the work performed this term, and of this web page, is the research into the hardware devices and medical issues that are associated with the ECG, and the development of the initial design specifications of the software interface. This web page will present the scope of the problem, the research highlights, and the design criteria and constraints for the user-interface. Progress thus far is also described.
Introduction to problem
This project concentrates on the analysis of cardiac function because of a few problems associated with the standard ECG tests:
-
ECGs are typically taken while the patient is resting, thus the doctor may miss abnormalities that occur with stress. This project can help by having the user record an ECG when they are experiencing the symptoms and then can have the recording analyzed later.
-
ECG tests are brief, thus some sporadic abnormalities may be missed. By making regular recording at home there is a greater chance that the abnormalities will be recorded and then can be interpreted by a doctor at a convenient time.
-
Finally, it is difficult to analyze an ECG trace without a reference ECG for an individual because there are so many variations between body characteristics of individuals. This project presents an opportunity to solve this problem, by storing and retrieving an ECG when the person has no cardiac disorder, it can serve as a norm (reference ECG) for that person, giving doctors a valuable diagnostic tool.
Finally, this project presents a unique opportunity to take the first step of making important health care sensory devices available to more of the public, as well as to educate and to potentially increase awareness of health issues.
Problem definition and scope
The aim of this Electrocardiography and Cardiac Function project is to develop a system capable of receiving the digital output from an electrocardiographic amplifier for display, analysis (i.e. calculation of heart rate), and to store these electrocardiograms (ECGs) electronically for future use and trend analysis on a personal computer.
There will also be a user profile incorporated into the system to customize and make the system more "intelligent" when performing calculations. Another goal is to incorporate educational information and tools into the system - providing guided tutorials on how to analysis an ECG trace, as well as giving health tips.
The problem can be split into three major components: hardware, software, and educational.
1.
Hardware
components
There
are
several
hardware
components
involved
in
this
project:
Electrodes
(sensors),
cables,
ECG
machine
(signal
amplifier
and
A/D
converter),
and
a
personal
computer.
This
project
will
not
be
redesigning
or
building
any
of
these
components,
however,
detailed
understanding
of
how
these
devices
operate
is
necessary
for
a
successful
integration
with
the
software
and
final
implementation.
2.
Software
components
There
will
be
several
components
to
the
software:
data
acquisition;
displaying
the
ECG
tracing;
calculation
of
heart
rate;
user
profile;
data
storage/retrieval;
analysis
of
trends
(e.g.
resting
heart
rate
over
time);
printing;
and
a
help
section.
There will not be a complex analysis engine that will analyze the ECG for irregularities - it was found that this would be too large of task given the complex nature of the ECG and variability among individuals and with placement of electrodes. However, there will be an educational component helping to analyze the ECG and provide other tips.
3.
Educational
and
cardiac
function
analysis
components
The
analysis
of
ECG
is
much
to
complex
to
apply
simple
computer
algorithms
or
rules
to
determine
what
arrhythmia,
if
any,
exist.
However,
this
project
will
provide
assistance
to
the
user
for
interpreting
whether
or
not
their
ECG
is
normal
based
upon
an
interactive
visual
and
textual
guide.
The
individual
will
be
walked
through
the
typical
checks
performed,
but
if
there
is
a
problem
they
will
be
told
to
refer
to
a
doctor
for
a
more
detailed
analysis
of
the
ECG.
Design methodology
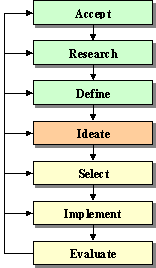
The traditional systems design approach is being used to solve the problem:
-
Accept - Get motivated and interested in the problem, and define the initial limits and scope of the problem
-
Research - Research issues around the problem
-
Define - Decide on the main issues and what needs to be done (i.e. clearly define the problem and what characteristics a solution will need to halve). Set limits on the problem and goals and constraints for solutions.
-
Ideate - Generate and search out possible ideas to help in reaching the goals then create a set of trial solutions. The project is currently in this design state and the following states need to be reached next term.
-
Select - Review the set of trial solutions discarding those that prove to be not feasible. Select the most promising for implementation and evaluation.
-
Implement - create the system to be evaluated
-
Evaluate - Determine how well the system meets the goals and solves the problem.
The bulk of the work on the project has also been divided into three major sections:
-
Cardiac function research and analysis - The research on the cardiac function is necessary to understand the hardware, and to assist in the development of the best possible interface.
-
Hardware research - The research into hardware will be to get an understanding of how the complete system will interact - it is not intended to develop new devices.
-
Software design - The software design will mainly be centred on usability and functionality of the interface.
Research
Cardiac Function
Role of the cardiovascular system
The cardiovascular system distributes nutrients, oxygen, and hormones to each of the roughly 75 trillion cells in the body. All of the functions of the cardiovascular system ultimately depend upon the heart which beats approximately 100 000 times a day.
Events of conduction
Certain ions, such as Na+ and Ca++ exhibit polarity, and action potentials (electrical signal) are generated from passage of these ions through the walls of cardiac muscle cells. Many cells participate in cardiac contraction, and electrocardiographic signals result from all ionic movement pertaining to numerous cells of the heart.
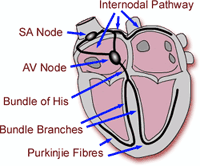
The following events occur when the heart "beats:"
-
SA Node fires action potential
-
Spreads to adjacent cells (through jap junctions)
-
Raid spread through cells of internodal pathway
-
Signal passed by AV Node only at AV junction
(Delays signal slightly to allow complete
contraction of atria). -
Bundles of His conduct signal to bottom of heart
-
Divides into left and right branches (Purkinje fibres) which transmit very rapidly
The ECG is a running record of action potentials of the thousands of cells in parts of the heart, and can provide important information about the health of the cells.
The electrocardiogram
The electrical events associated with the depolarization and repolarization of the heart is powerful enough to be detected by electrodes placed on the body surface.
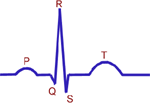
A recording of these electrical activities constitutes an electrocardiogram (ECG or EKG). The figure to the left is an example of a typical ECG.
Common arrhythmias
An arrhythmia is an abnormal heart rhythm. These can occur for many reasons, some common causes are: when another part of the heart takes over as pacemaker, or when the SA node develops an abnormal rate or rhythm, or even when the normal conduction pathway is interrupted.
Some of the more common types of arrhythmias are:
Sinus bradycardia - A slower than normal heart rate, typically less than 60 beats per minute (bpm). It may occur as a result of physical conditioning, and serious cases result from blockages in conducting pathways of the heart.
Sinus tachycardia - A faster than normal heart rate, typically greater than 100 bpm. It may be irregular or regular in rhythm.
Sinus arrhythmia - Impulses originate at SA node at varying rate. All complexes are normal but are rhythmically irregular, with variations of greater than 10% in duration.
There are many more types of arrhythmias, but for the purposes of this system, it would be near impossible for an individual without formal training to identify all the arrhythmias.
It would be easier to differentiate between what appears normal or definitely abnormal. After an abnormality is seen, the appropriate medical professional can then identify it.
Sequence for systematically reading an ECG
The following are an abbreviated version of the steps and questions to ask when analyzing and ECG trace. If the Stage characteristics are normal then you move to the next stage. If they are not, there could be many different reasons for the irregularity, and the diagnosis should be made by the appropriate medical professional.
Step
I.
the
rate
The
heart
rate
should
be
between
60
to
100
bpm
(distance
between
the
P-P
or
R-R
waves).
Step
II.
the
rhythm
There
should
be
less
than
10%
variation
in
the
heart
rate
(between
the
P-P
or
R-R
waves)
Step
III.
the
QRS
complex
Does
a
QRS
complex
follow
every
P
wave?
Also,
is
the
size
and
duration
of
the
QRS
complex
normal?
The
duration
should
be
less
than
0.12s
and
greater
than
.05s.
Step
IV.
t
wave
Check
for
a
normal
T
Wave.
Typically,
the
amplitude
of
the
T
wave
should
be
less
than
0.8
mV
and
the
duration
should
be
between
0.1s
and
.25s.
Hardware research
Placement of electrodes for lead II ECG
The electrodes for the lead II ECG can be placed in the following locations:
-
reference electrode, (usually green) on the just below the right nipple on the 5th rib;
-
positive signal electrode, (usually black) just below the left nipple on the 5th rib; and
-
the negative signal electrode, (usually white) about 2 cm below the v in your neck in the centre of the manubrium of the sternum.
Basic Components of a typical ECG system:

Sources of noise
The heart is just one of the masses of cells undergoing ionic movement during a cardiac cycle. Muscular activity, neural transmissions, and more can all be found in the signal on the skin, along with external noise (such as cable artifact).
Simplified impedances associated with an ECG system

For an ideal situation the impedance due tissue between the heart and skin, the skin, the electrodes, etc., would not exist, while the impedance of the amplifier would be infinitely large. This would allow all voltage from the biologic source (the heart) to transfer to the terminals of the amplifier.
Ideal differential amplifier
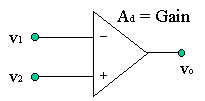
The typical ECG amplifier has a differential input, which means, if the amplifier is ideal the output corresponds only to the difference between the two signals at the two posts of the input to the amplifier (If equal -> output is 0).
A real ECG amplifier is imperfect and delivers and output with at least two other voltages (Acvc and van). Ac is the common-mode gain and the noise produced in the amplifier is van (negligible if properly designed).
vo
=
Advd
+
Acvc
vo
=
Advd[1+(1/CMRR)(vc/vd)]
where CMRR = Common Mode Rejection Ratio
CMRR
=
1
|
Ad/Ac
|
Ad
=
½
(A1-A2)
Ac
=
½
(A1+A2)
vd
=
½
(v1-v2)
vd
=
½
(v1+v2)
Common Mode Rejection = 20 log (CMRR) = 170 dB (typically)
Block
diagram
of
an
ECG
amplifier
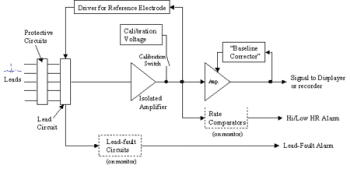
A couple of the key features for this diagram that are necessary to understand when displaying the information in software are: calibration, ECG machines are calibrated at a standard rate and amplification and when the calibration button is pressed a deflection of 10mm should appear on all printouts; baseline corrector, the baseline corrector provides and artificial zero on the readout; rate comparators, these are heart rate levels that are set to trigger an alarm when the heart rate is too high or low.
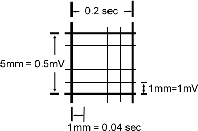
It should also be mentioned that the ECG machines are calibrated for a paper (or display) speed of 25mm/sec and an amplification gain such that 10mm on paper equals 1mV change in potential. This is reflected in special paper used for printing the ECGs.
Design criteria and constraints
With a firm definition of the problem and a considerable amount of research, the criteria and constraints for the software design and integration aspect of the project can be developed. The design constraints define the necessary conditions that all generated designs must meet. The design criteria define the means by which generated designs are evaluated relative to each other. Together, the criteria and constraints will be used in the design concept selection process to choose a feasible optimal design.
Constraints
In order to eliminate blatantly inadequate designs, all new designs should be checked against design constraints to see if they meet the minimum set of requirements for the new design. Five constraints have been defined for the design.
-
Electrical isolation - The system must keep the individual electrically isolated.
-
Calibration - The system must be able to determine if it is calibrated correctly.
-
Display of ECG - The system must display the ECG readings accurately and at the appropriate rate (25mm/sec).
-
Storage - The system must be able make a recording and store the ECG.
-
Heart rate - The system must calculate the heart rate based upon the ECG data.
Criteria
Since their will be no comparison of solutions, only the development of one good software application, the following criteria will be used to guide the development and evaluation of the software and integration aspects of the project.
-
Cost - The cost associated with the system will play a role in determining the availability of the system.
-
Usability - Since the main focus of this project is making ECG available to more individuals, many of whom have no formal training or software background, will mean that the easier the product is to use the greater the success. Also, the easier and more comfortable it is to attach the electrodes and perform these measurements the greater the success of the system.
-
Psychological comfort - The less stress caused by this system the greater its success. For example, it would not be advisable to have messages such as, "You are about to have a heart attack!" appear on the screen.
-
Diagnostic capability - The greater the diagnostic capability of the product the more anomalies that can be found and the number of potential lives that can be lengthened may increase, which has intangible value.
-
Trend analysis - The more trends that can be analyzed the greater the chance the device will be used over a longer period of time (i.e. for fitness), which makes the product more successful.
-
Educational value - The more education value the product will have, the greater the value of the product for individuals, and educational institutions.
Initial interface design sketches
The next major step is to develop the higher-level user interface.
The following sketches were created as a preliminary design and to inspire the generation of ideas for improvements or additions.
Initial welcome screen

The concept is to have the welcome screen ask for a user name and password to sign in, or to create a new profile. Another additional feature would be a health tip of the day (with a link to more information on that health topic).
Now after the user logs into the program, they are presented with the main user-interface (a preliminary sketch is seen below):

The ECG will be displayed with the appropriate amplitude and scroll speed (25mm/sec), and showing the grid will be optional (useful when doing the analysis).
The analysis section of the above interface will be interactive, based upon the individual's selection of yes or no answers, it will guide the user to a decision of whether or not the ECG is normal.
The goal of the "show trends" section is to plot the heart rate (for the different body states: resting, light exercise, heavy exercise, etc.) of the individual over time.
The "print" option should be able to print the given ECG out on a printer (with the grid, title, and other important information).
The majority of next term will be spent creating a similar interface as the one above and integrating it with the hardware for testing and evaluation.